The ACCESS Winter Rainfall Summit May 2017
On 15 May 2017, a blisteringly hot day (32°C at the nearby South African Astronomical Observatory weather station), ACCESS held a Winter Rainfall Summit at the National Geo-spatial Information meeting room in Mowbray. For the morning sessions a collection of scientists working on variability/predictability of winter rainfall were assembled to present and discuss the present state of understanding on the topic, before media and stakeholders were invited for an open discussion and statement release in the afternoon. As a PhD student just starting an investigation in this direction, I was very fortunate to have been able to attend the session; ideas discussed at the meeting have helped shape my perspectives and focus in framing a research goal. While many interesting topics were addressed at the meeting (slides of presentations made are available here), the primary source of controversy was the use seasonal forecasting systems to try to give a prognosis for the 2017 core winter (June–August, or JJA) rainfall season, especially given the limited skill dynamical forecasting systems display over the winter rainfall domain. All forecasts discussed at the summit, including the SAWS and Willem Landman’s (UP/CSIR) NMME forecasts, suggested tentatively that a wetter than normal JJA could be expected. So, now that JJA has come and gone, the dams are still at 37.6% (after the first weekly net drop in dam levels since June, amounting to 0.1%, occurred 2 weeks ago!) and Piotr has provided us with a chilling perspective on the current drought, I’d like to reflect on the summit in the context of (a) rainfall figures available for JJA 2017; and (b) points raised at the meeting, which I would like to arrange around a couple of key themes I felt emerged from the discussion. For those not interested in the whole long slog that follows, I’ve written a summary of the post at the bottom. But first, let’s take a look at what actually happened:
Observed Rainfall
One of the key themes I will look at is the availability of rainfall data, an issue also addressed briefly by Piotr. The difficulty in accessing up-to-date official rainfall records greatly impedes our ability to make authoritative statements about the state of the current drought (or counter false or misleading statements already in the public domain). For this post I use data obtained from three publicly available sources:
- Monthly (preliminary) rainfall data from the South African Weather Service (SAWS), published every month here (I’ve been downloading these since 2011 and checked the recent values against complete data supplied to CSAG by SAWS and where there are data available from both, they do not differ by more than 2mm for any 1 month; older versions are not publicly archived). The long-term means for these stations are those provided by SAWS (either 1971-2000 or 1981-2010, I think?). I’ve selected a set of stations situated in the Winter Rainfall region.
- The weekly City of Cape Town dam levels document, which includes data for a selection of stations near dams supplying/situated around Cape Town (Older versions are again not archived; monthly totals are computed manually where necessary). The long-term mean values used for these stations are also those provided in the document (I don’t know the reference period here).
- Jasper Slingsby’s brilliant, regularly updated Jonkershoek Drought Monitor blog, which includes monthly rainfall figures for a weather station on the Dwarsberg plateau (roughly the watershed between the Riviersonderend and Berg River, which feed into our largest and third largest supply dams, respectively), as well as a long-term monthly climatology for 1945-1991 (and some data since 2013). This weather station is now managed by the South African Environmental Observation Network (SAEON), together with two other high altitude stations in the Western Cape, for which current data are available live (Constantiaberg and Cedarberg).
In addition to these sources, I will also be consulting the highly informative Umlindi newsletters of the ARC, especially the September edition, which includes an assessment of the JJA season.
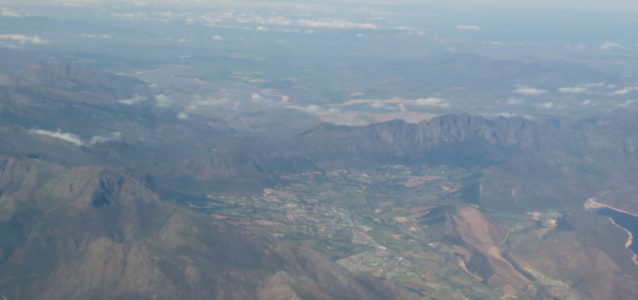
At the beginning of June, Cape Town was struck by a high-profile strong frontal system, characterised by steep pressure and temperature gradients and consequently violent winds (receiving attention in international media: e.g. here and here; and resulting in much activity on Twitter, under #Capestorm and #KnysnaFires). It resulted in severe wind damage, lightning deaths, coastal flooding and destructive wildfires around Knysna. Many media outlets carried headlines suggesting this was “the worst storm in 30 years” to hit the Cape Peninsula, mostly with no apparent source or justification for this strong claim, which appears to have originated from a prediction from SAWS (since this characterisation first appeared before the storm made landfall and appears not to have been reassessed subsequently; a Western Cape disaster management official (James-Brent Styan) also appears to have contributed to the spread of the widely quoted statement). A brief search shows that a much more powerful storm struck in May 1984 (33 years ago), but also that storms of at least similar strength to the 2017 one have struck Cape Town since then; a September 2001 storm (well documented in this interesting article from SAWS, which also looks at the 1984 storm) appears to stand out as the worst of them. The only observational criterion by which this year’s storm seems to have been “the worst in decades”, is the wave height recorded by the CSIR off the coast of Kommetjie; however this seems to have had much to do with the storm almost coinciding with Spring tide, as a number of the previous large storms incidentally appear to have done as well. Finally, an interesting coincidence is that the great gale of 1865, the storms of 1984 and 2001, and of course 2017, all peaked early on a Wednesday morning…
Despite the hype (and some very poor reporting, including widely repeated false claims regarding El Niño influence, contradicting published findings from UCT Oceanography Dept. researchers), at least in terms of rainfall, the June 2017 storm failed to meet expectations (heavier rain was recorded during a single day on September at Newlands Reservoir than over the duration of the storm at any urban location), but it did provide a lift to monthly rainfall figures in most locations in the winter rainfall zone (WRZ), with near- to above-normal rainfall being prevalent (see table 1 below). Thus hopes were raised of a wet winter, which would quell the drought.
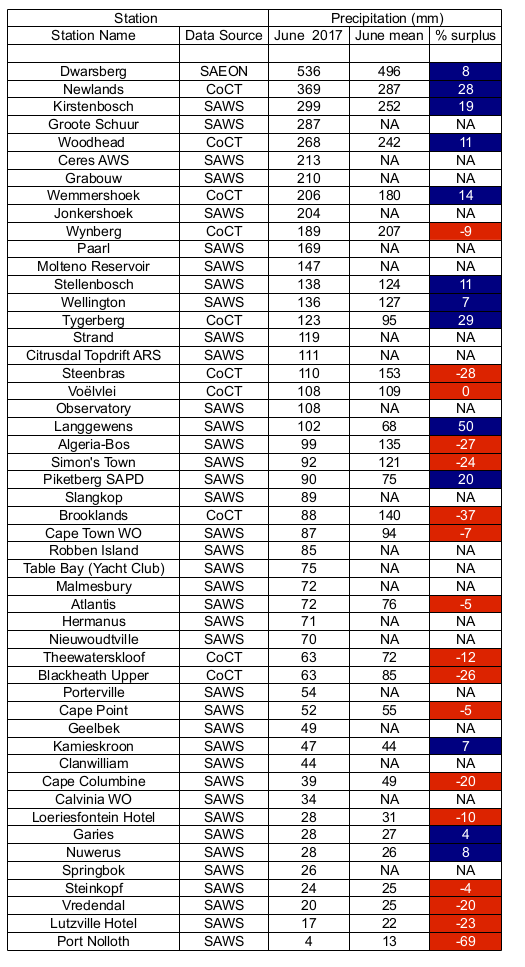
Ass Table 1: Rainfall figures at various stations in the winter rainfall zone, indicating the data source (see list above for details), received rainfall, average rainfall (where available) and the relative rainfall exceedance (positive/blue) of the average or rainfall shortfall (negative/red), expressed as a percentage of the average. Stations are arranged by rainfall received in June 2017, in descending order.
However, the second half of June was relatively dry and July was very dry (most of the WRZ received rainfall totals in the bottom 30% of the recent historical distribution, according to Umlindi, with the shortfalls being particularly severe in the north-east of the region). Among all the stations considered in Table 2 below, only Cape Point received (slightly) above normal rainfall in this month. Dam levels, which had responded slowly to June rainfall (presumably due to low soil moisture levels from the extremely hot and dry preceding autumn, resulting in greater soil absorption and lower outflow from the subsurface reservoir, as ecologists and hydrologists warned at the summit; see also Midgley and Scott, 1991 and Midgley et al., 2001), continued to increase only marginally during July. August rainfall was slightly better, especially in the south-west, but still below average across most of the WRZ (see Table 2). For the JJA season as whole, therefore, all stations except Cape Point experienced a drier than normal season, with deficits of at least 11% of the mean and as large as 79% of the mean in Port Nolloth. the largest deficits, as may be expected, where experienced at normally dry stations in the northern WRZ, with deficits here generally greater than 40% of the mean. One prominent exception, however, is the Algeria Forestry weather station in the Cedarberg—usually one of the wettest stations in the WRZ, with a JJA average of 368mm—where only 163mm fell this winter, corresponding to just 41% of a normal winter. This contributed to Algeria recording what appears to be it’s driest 12-month period to August (i.e. Sept 2016–August 2017), in almost a century of record keeping. The authors of recent Umlindi issues have suggested that the winter, at least from mid-June, has been characterised by a near-normal number of frontal systems passing through, but most of them being weak, and located further south of the country than usual, and thus not penetrating as far in land as normal. This could help explain the smaller deficits towards the south of the domain (and even surplus at the southern most station at Cape Point) and very large deficits in the north.
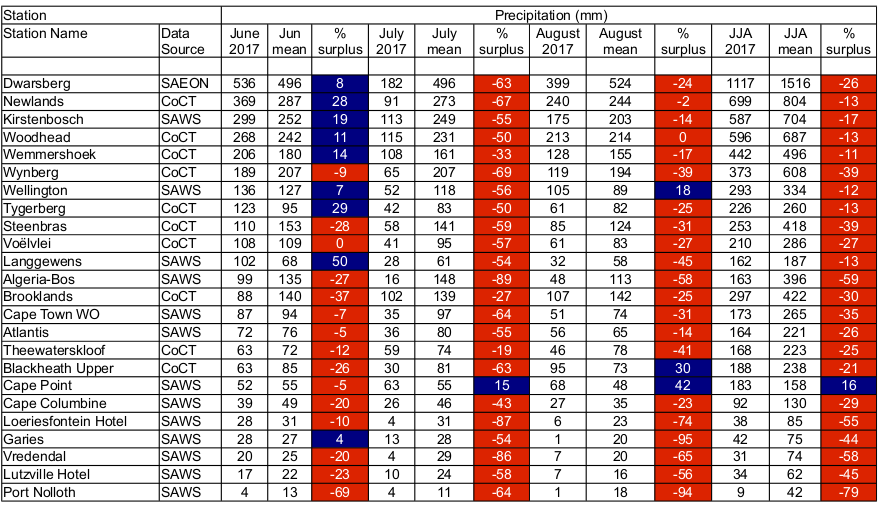
Table 2: As for Table 1, but now for June, July and August, as well as the season as a whole, and including only stations reporting during all months, and for which average data are available.
A seasonal rainfall total map for the Western Cape included in the September 2017 issue of Umlindi paints a similar picture. It seems reasonable to conclude, therefore, that the WRZ experienced a dry Winter—not in itself unprecedented—but which still produced significant negative consequences, coming as it did after 3 consecutive very dry Autumns (especially May), Springs (especially 2014 and 2015) and Summers. So, what does this mean for what was discussed at the summit?
Three Key Themes:
The themes I’d like to structure the reflection around are:
- Data availability
- Are Winter rainfall forecasts useful? Should they be issued?
- Should we focus on JJA only?
Data availability
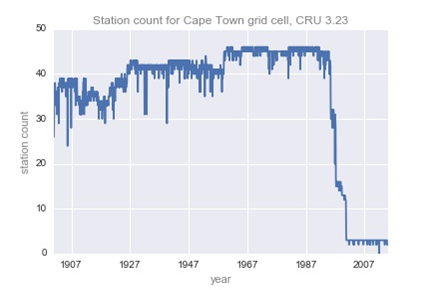
Let’s start by looking at the thorny question of data availability. There appeared to be a general consensus among speakers and other researchers present that a major stumbling block for advancing research over the WRZ is that high-quality data with sufficient spatial coverage are not readily (or freely) available from many government institutions/departments with station data (especially the South African Weather Service (SAWS) and the Agricultural Research Council (ARC), but also the City of Cape Town, SAEON, Cape Nature, SANParks and others) and that data sharing between institutions is often limited. One researcher pointed out that he could only have access to station data from SAWS while he supervised a student working on a related topic. The problem applies even if the data are to be used for research purposes only, as was affirmed by other students I’ve spoken to recently (including at SASAS 2017), who are often limited in the data they may use to a few stations, which have not been properly quality-controlled and/or have a short period of record (POR). On the other hand, in a striking presentation at SASAS 2017, PhD student Lerato Mpheshea demonstrated widespread and severe inconsistencies between different freely available spatial datasets obtained from sources such as satellite estimates of precipitation. At the May Summit, Chris Jack showed the drastic decline in the number of stations available to be used for the CRU gridded precipitation data set’s Cape Town grid cell, which is widely used for research on rainfall variability and change (e.g. Dieppois et al., 2016). In part this follows a general decline in the spatial coverage of weather stations globally and especially in sub-Saharan Africa since the 1970s and associated reductions in quality and reliability of measuring stations, and in part it is a result of data policy changes. Both are serious concerns, which severely limit the scientific community’s ability to detect, attribute, understand and predict variability and changes in the climate system and consequently our capacity as a society to respond to the threats posed by a rapidly changing climate. It should be noted that at CSAG we are fortunate to have access to a large bank of SAWS and other station data from the joint SAWS-CCWR dataset, through a comparatively very generous MoU with SAWS, as well as the hard work of members of our group who manage and quality control these data, without which the research on station data I have thus far conducted for the beginnings of my PhD project would have been completely impossible.
At the May Summit, it was also noted that the spatial complexity (especially due to the Cape Fold Mountains and Western Escarpment) and substantial and understudied low-frequency variability (i.e. long-period natural variability) of WRZ climate makes long-period, spatially extensive and dense station data essential for robust research. For example, substantial variability, especially an apparent quasi-40-year cycle in rainfall, dominates any long-term trend in winter rainfall statistics over the WRZ as a whole (see, e.g., Mathieu Rouault’s presentation) and at this scale, by the end of December 2016 the present drought was still well within the bounds of historical variability. However, looking at the very wet Dwarsberg station (probably the wettest in extratropical southern Africa!), measuring rainfall in a region critical for Cape Town’s water supply and the subject of Jasper Slingsby’s talk, when considering a similar time frame, shows an apparent downward trend emerging from the substantial interannual variability, with 2015 and 2016 the driest years on record, 2014 not far behind and 2017 thus far probably the worst of the lot!
Fortunately, there was some potentially good news at the May Summit. Most importantly, a SAWS representative announced that they are currently reviewing their data policy. This could result in a major change in the South African climate research landscape, and I’m sure many others with me eagerly await the conclusion of this process. How optimistic we should be of any changes being made is not something I am sufficiently in-the-know about to say much about, however. Additionally, the City of Cape Town’s energy efficiency campaign strategist (at least at the time), Sarah Rushmere, stated that, if it would help with research towards winter rainfall predictability, they would make all their station data freely available to researchers. Thus far, nothing appears to have come of this (and some students have subsequently continued to struggle to obtain station data from the city). I’m also not sure whether the statement was particularly clearly thought through; it was made in a passionate plea to those present to provide the city with consistent, clear guidance and prediction as far ahead as possible, which, when interrogated with trademark sobriety by Chris Jack, led to the city’s water supply manager (again, at the time), Barry Wood, admitting that the city would be unlikely to make much use of a dynamical seasonal (or interannual) forecast, given the risks involved, the lack of certainty and the statistical-hydrological model already in use. However, I would still strongly suggest that we take the city up on this offer, work with the data to assess long-term variability and change in the dam catchments and use public pressure if necessary, if the city goes back on their promise of providing data.
So, on this front, watch this space…
Seasonal forecasts for the WRZ
The main controversy of the day surrounded the question of whether forecasts of JJA rainfall over the WRZ are currently useful and whether it is responsible practice to disseminate such forecasts to “stakeholders” (climate communication is not at all my field of expertise and consequently I apologise for probably not always using the most appropriate terminology). On the one hand, Chris Jack of CSAG, among the climate scientists present, was essentially a lone voice justifying CSAG’s recent decision to no longer publicise seasonal forecasts. He suggested (I hope I’m presenting this accurately?) that even with qualifications regarding the limited skill and probabilistic nature of such forecasts, it would be irresponsible to present a consensus forecast of a wetter winter this year, especially given the potentially dire consequences if such a forecast proved to be “wrong” (as we now know it did; although, of course, given the probabilistic nature of such forecasts, seasonal forecasts are never strictly wrong). On the other hand, representatives from SAWS, the CSIR and UP contended that any skill, however limited, implies that long-term, consistent adherence in planning to such forecasts will lead to a net benefit. While a “consensus position” document was being drafted at the meeting, which led to substantial debate, the question was even raised why scientists bother developing and running seasonal forecast models if the output can’t be shared with potential users. The official SAWS seasonal forecast release (from May 3) contained the following rather vague paragraph: “There has been continuous indication of above-normal rainfall for the [WRZ]. Unfortunately, none of these forecasts show a high degree confidence and as such should be viewed cautiously. Due to the negative impact of drier conditions that could possible occur, it is recommended that plans be in place to alleviate the impacts of such events”. SAWS presented one forecast map which only provides projections where past forecasts showed skill; this leaves most of the Western Cape blank, but interestingly, based on the Umlindi rainfall map, it seems that the two small regions receiving above normal rainfall in the Western Cape did fall inside the regions where SAWS indicated some confidence in a wetter season. However, most of the region where wetter conditions were indicated (which also happens to be some of the least densely populated parts of the province), were dry to very dry this past season.
From my very inexperienced, outsider’s position in the seasonal forecasting space, the idea that, as long as a forecast is “right” more often than “wrong” it will bring long-term benefit, appears to be a very dangerous example of linear, “symmetric” thinking: in particular, it seems to assume that the “cost” of responding to an incorrect “wet” forecast is approximately equivalent to the benefit of responding to a correct “wet” forecast. In the present case, it seems clear that if “stakeholders”/”users”/”planners” had assumed, as most forecasts suggested, that a wet winter was more likely than a dry one, the associated cost of a presumably more rapid depletion of Cape Town’s water reserves would be catastrophic and would far outweigh the benefits that would have accrued from the slightly higher water consumption that might have been feasible in a wetter winter, for example. Even the suggestion of higher water consumption being allowed in a wetter season is questionable though; for example, Barry Wood stated that even if a relatively wet winter occurred, strict water restrictions would still be needed to help dam levels recover and that at least three normal winters would be needed to refill all the major dams. Also, it would take a while to refill the various mountain aquifers in dam catchments, thus reducing run-off potential and even if rainfall was good in JJA; it’s getting hotter, increasing evaporation; the 21st century outlook for the WRZ’s rainfall is rather bleak; and a dry autumn and/or spring could completely offset gains from even an unusually wet JJA. Which brings me to the next point:
Don’t forget Autumn and Spring!
It is common practice in seasonal forecasting to make predictions for traditional 3-month climatological seasons. The standard seasonal split is DJF (i.e. December–February; Austral summer), MAM (autumn), JJA (winter) and SON (spring). Forecasts for alternative 3-month seasons are also sometimes made (e.g., May-July or MJJ). In the WRZ, it is important to note that, on average, the wettest months are June and July, followed closely by August and May; in some places, for certain reference periods, May is wetter than August, and depending on the period, July may wetter than June, or very similar to August. Therefore, the practically most relevant forecast would appear to be for MJJA, a four month period. This is, however, complicated by the observation that the rainfall seasonality appears to be shifting, and July-September’s contribution appears to be becoming more significant. On the whole, rainfall during all months between April and October “matters”. Slingsby’s analysis, for example, considers a 6 month winter (April-September) and 6 month summer season (October-March). Over the mountain catchment regions he considers, and especially in the south-eastern regions of the WRZ, summer orographic rainfall (along the frequently cloud-covered mountain chains) contributes substantially to total precipitation and for Cape Town dam storage, consideration of (the extended) summer is crucial. As an illustration, average summer (October-March) rainfall at the Dwarsberg station is about 800mm, or about as much as falls in Joburg on average in an entire year! Furthermore, a quick analysis of the average rainfall by standard season over the WRZ from 1901-2015 suggests that the rainfall in the different seasons are essentially uncorrelated. This means that a forecast for JJA, for example, would tell you almost nothing about what one might expect during MAM or SON. And a lot of especially the long-term variability in rainfall over the WRZ, as well as trends that are starting to appear in some rainfall series, appear during these two so-called “shoulder seasons” and especially April, May, September and October.
Looking at the present drought, this is particularly relevant. At the Dwarsberg station, for which recent records and corresponding averages are easily accessible and which is very relevant for dam levels (as noted before), the average rainfall shortfall (contribution to the drought, in a sense) by month, since August 2014, are approximately: April: 170mm, May: 320mm, June: 120mm, July: 130mm, August: 230mm, September: 150mm and October: 150mm. For the summer months, the values are much smaller, but each of the last three summers have been unusually dry. Clearly, May is by some margin the most significant contributor to the drought, yet it was not considered explicitly at the summit. The smallest contributions have come from the two central winter months, indicating that the core winter has not been the primary driver of the severity of the present drought. In fact, it has been noted in a number of Umlindi issues that recent Mays and August-Septembers have been characterised by “summer-like” circulation patterns and extraordinary heat across much of the country. This year, while the WRZ endured severe drought conditions, unusual wide-spread rains were recorded over large parts of the summer-rainfall region. Could this indicate a shift in the seasonal cycle over southern Africa, a move towards a fundamentally different climate regime, previously all but impossible, and now suddenly much more likely in a rapidly warming world—a terrifying taste of what the coming century holds for WRZ? It’s certainly too early to tell at the moment, but for the time being, this past September has continued the dry shoulder month trend of the past 3 years, with stations around Cape Town recording 25-60% of normal rainfall and the Cedarberg region continuing its remarkably dry winter with around 10% of normal rainfall at Clanwilliam and Algeria.
Summary and Conclusions
So, as promised a quick summary of the post:
- ACCESS held a Winter Rainfall Summit in May to see whether a consensus scientific position on the prospects of the coming winter season and the current drought more generally could be established and communicated to stakeholders and media.
- A consensus position on the winter forecast was not achieved; the confidence in current seasonal forecasts of winter rain in western South Africa is weak and there were unresolved differences among scientists present about whether it would still be responsible/useful to disseminate a forecast in these circumstances.
- Forecasts of all the modelling centres that were considered suggested that the winter was most likely to be wetter than normal, although there was still an approximately 25% chance that it would be drier than normal.
- My assessment presented here and that shown in the September issue of the ARC Umlindi newsletter agree that over the winter rainfall zone (WRZ) this winter was drier than normal almost everywhere.
- While the summit focussed on the core winter season June-July-August (JJA), it was emphasised by those studying WRZ rainfall that the so-called shoulder seasons, including April, May, September and October are also very important to consider.
- The present drought seems to be driven more by dry autumns and springs than core winter months, and it seems that there have been a number of months in recent years characterised by summer conditions occurring much earlier and continuing much later than is normal.
- This pattern may be the first taste of what we can expect in a hotter world in the coming century, with much hotter and probably longer summers being virtually certain and winter drying projected under climate change by almost all climate change modelling groups.
- We will need more than one wet winter to end the current drought and water crisis and as such there is also considerable interest not just in seasonal (3-month) predictions for the WRZ, but also forecasts for 2-3 years in advance as well, including all seasons and possibly some indication of evaporative demand as well.
- Assessing how bad the current drought is, how it compares to previous droughts and fits in with natural patterns of rainfall variability and whether there are trends in WRZ rainfall is very difficult to assess. This is largely due to data access for researchers and students being limited by government institutions who hold these data, data quality often being relatively poor and the region having very complex patterns of spatial and long-term temporal variability.
- In particular, Helen Zille’s claim (at least it seems to be attributable to the premier) in May that we are in the worst drought since 1904 (apparently reported unquestioningly by various media outlets), is difficult to verify, in part because of the City of Cape Town’s reluctance to share its data. At least some evidence suggests that droughts occurring in the 1920s-1930s and 1970s were as bad or worse than the current drought in large parts of the WRZ, at least for data up to April.
So, where does this leave us? One thing I have been thinking about, in terms of communicating a responsible message in the current sort of situation, is that it might be worth stating as a key message from a seasonal prediction that there remains an at least 25% chance that the winter will again be dry (which under the circumstances, somewhat counter-intuitively, may still be more likely than no forecast to encourage preparation for a potentially catastrophic dry season). At any rate, it seems like there is significant scope for scientific enquiry into what drives winter rainfall variability, whether there are signs of shifts or trends in the historical record to date and what is driving the current drought. This, in turn, would hopefully help us to be able to better predict seasons ahead and give some sort of informed answer to questions like “when will this drought end?” Getting through this drought may be our immediate priority, but being better prepared for the following one, whenever it may come, is a matter that should be investigated with similar urgency. And much work remains to be done in the very murky waters between unsolved, cutting-edge science questions and questions around water supply and service delivery to the growing population of the WRZ, which, fortunately for me, lie beyond the scope of my own work…
Gavin Heath
Most interesting, thank you for this synopsis.