This site facilitates the download of the WASA time series data for each grid of the full 30-year period of the mesoscale simulation as a text-based csv file.
Please read this this metadata document to for information about the time series data content.
All WASA3 reports are duplicated and available here, please read the Mesoscale report for details about the modelling component of the project.
r
Below describes how we generate and serve the time-series data on the portal.
Please read this full page – it will save you a lot of pain.
Chrome or Firefox browsers are recommended.
r
1. How is the .csv file created? (Because this determines how long you will have to wait…)
- There are more than 285 000 grid points in the mesoscale model domain, each with 30 years of 30-minutely data at 14 vertical levels – so it is a huge dataset.
- Because of the size of the data, it is stored in a data format called “zarr”, and in 525 000 “chunks” where each chunk has a particular subset of data in it.
- When you make a request, data at the lat-lon coordinate you requested is extracted from these 525 000 chunks – this takes a very long time because each chunk must be opened, the data located and extracted, and closed again. Typical extraction time for a grid cell is about 3 hours.
- Once this extraction is completed, the data are then converted into ascii format (csv), placed in a separate cache and served to the Wind Atlas portal where you then download it.
- At the moment, because of limited resource capacity, we can only run 6 extractions at any one time. So depending on where your request is in the queue, the extraction could take three hours or up to a few days.
If there are hundreds of queued jobs, it may even take a week for your request to reach the front of the queue and be processed.
How do I know how long the queue is? This information is on the map….
f
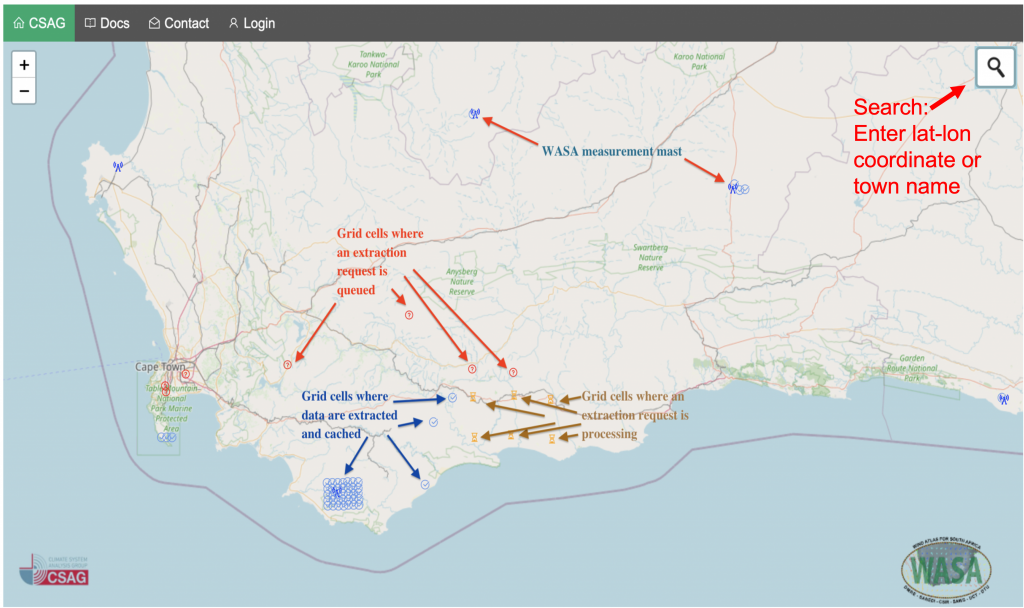
2. What’s on the portal map?
The grey-shaded area on the map is the 631×454 WASA mesoscale domain containing 286 474 grid cells (not visible).
If you look at the picture of the map over the western Cape below you will see blue ticks, orange hourglasses and red “?”s in a circle. And regions where there are no symbols at all.
- A red “?” in a circle means the job is queued and will run when a processing core becomes available.
- Orange hour glasses are jobs that are currently being processed. There are 6 of these and each one should take about 3 hours to complete from the time it starts.
- Blue ticks represent grids that have been processed and cached….these will download quickly.
- Radio tower symbols. These are the positions of the 19 observation masts. Note – data from grid cell with masts in them are not mast data, they are the mesoscale data. Mast data is downloadable from the main WASA download site.
- Only the map. Here no requests have been made previously. Clicking on a location where none of the above symbols are present will initiate a new extraction process (see below).
r
3. How do I download the grid cell I want?
a) Blue tick = cached data = fast!
If you click on a blue tick a message will appear:
“The CSV file for this grid cell can be downloaded. Download me!”
- Clicking the “Download me” link will download the data as a csv file. It could take 1-5 minutes for the full file to download. You can then save the csv file from your browser.
- Or if you right-click the “Download me” link you can use the“Save as” functionality of your browser to download the file directly to your computer.
b) Orange hour-glasses – currently extracting – a bit of a wait.
There should be a maximum of six of these. These represent grid cells that are currently being extracted. This process takes about 3 hours and then the orange hour glass should change to a blue tick.
c) Unmarked sections of the map = no requests yet = uncached = slow!
- Unmarked, symbol free parts of the map have not had any requests yet and the full process described above will need to execute.
- When you click on an unmarked grid cell a bubble will pop up with a link to click asking to extract. “Click the link to extract.”
- When you click this will take you to a new tab with a progress bar and a message about the status of your request.
- If you go back to the map you see a red “?” has appeared on the grid cell you selected – this means your request has been queued.
- Eventually, running jobs will finish, orange hour glasses will change to blue ticks and some red “?” will change to orange hour glasses to show they are processing.
- Your job will run once it reaches the front of the queue. Unfortunately we have not figured out how to know where in the queue your reenact it.
Note: If there are hundreds of queued jobs (lots of red “?” on the map), it may take a week for your queued request to reach the front of the queue and be processed.
d) Lib Files
- We have also made the lib files available for download on the Time Series Portal. Selecting any grid on the map will provide an option to download the lib file for that grid. This download will be immediate regardless of the status of the time series data availability as it is a separate, small dataset.
f
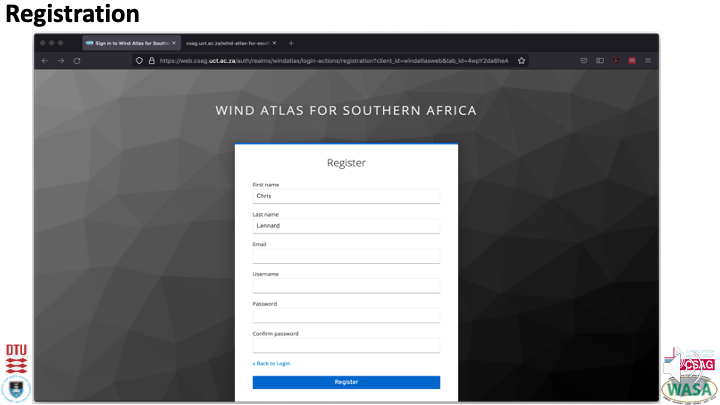
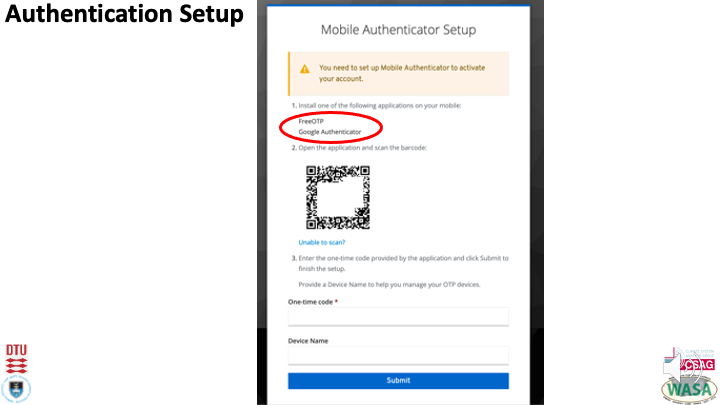
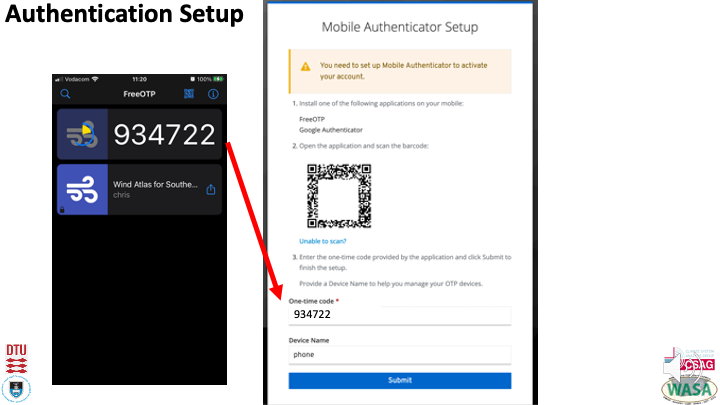
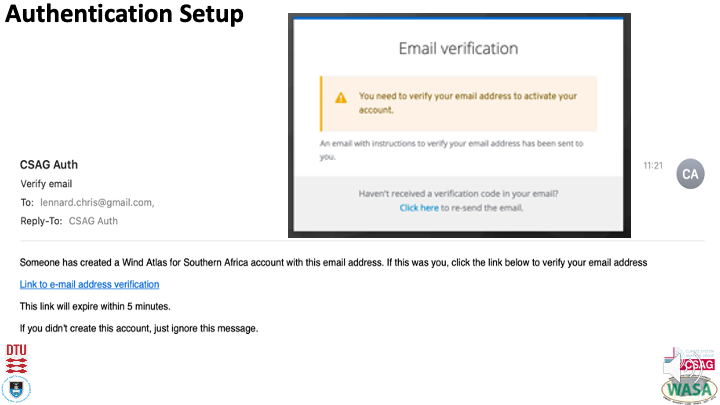
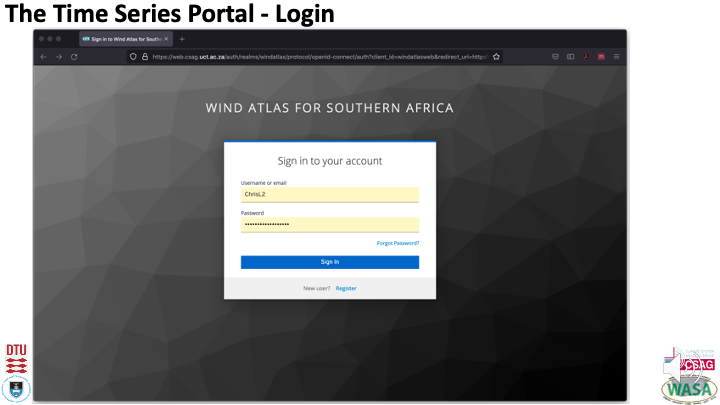
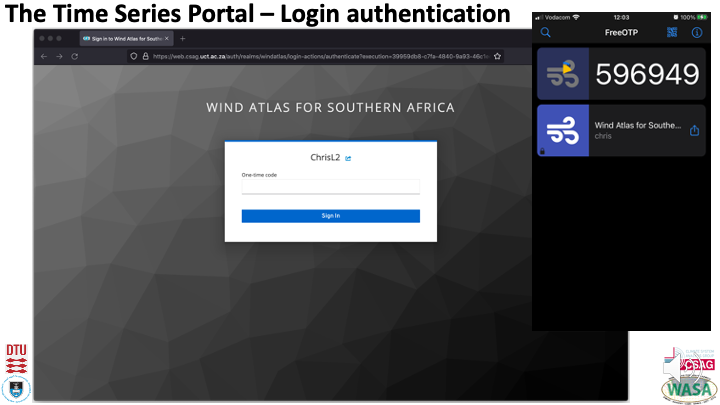
4. Logging into the portal (authentication required)
Regrettably, due to potential security risks to the CSAG computational infrastructure, this step is necessary.
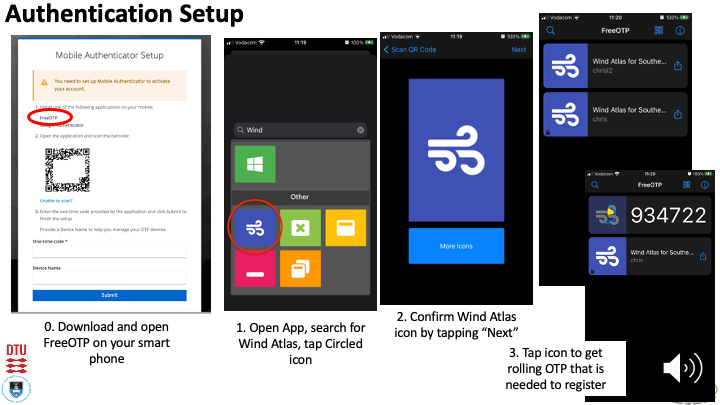
To access the portal you will need to download the FreeOTP or Google Authenticator app on your cell phone and use the OTP provided by the app to access the portal site.
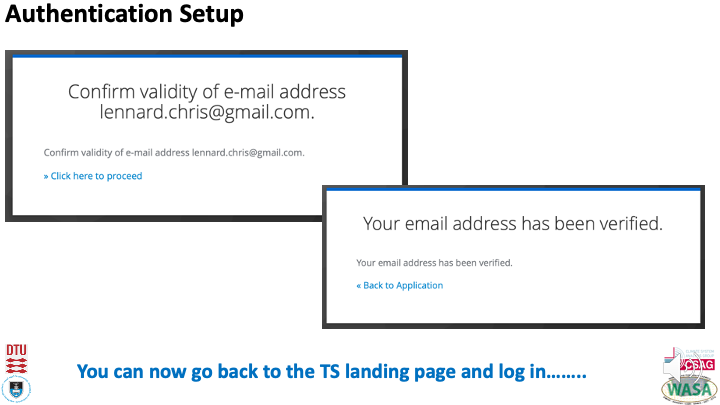
Once you have downloaded the app, follow the sequence below to register and login.
f
f
f
5. Something to note
The location of each selected download site (blue ticks) is publicly visible on the portal. Although there is no indication of who made the request at a particular site, if a location is sensitive for your application and you would like your download to not reflect on the map please contact Chris Lennard at CSAG and we will extract the coordinate for you at a cost of R1000 per grid cell extraction. Please note that if a different user downloads that same coordinate from the portal five minutes after you get it from us, the blue tick will appear on the map….so it’s a gamble.
f
Acknowledgement
By clicking the link to the data portal below I acknowledge I have read the above information, understand its content and accept the conditions stated in this metadata document.
Please follow this link to the portal where you will begin the registration process.
If you have questions please contact Chris Lennard.