
Due to climate change, the climate system is undergoing a shift towards a new climate state. Locally, the effects of this transitioning has been described by the Western Cape Government (WCG):
“South Africa isn’t safe from the effects of climate change. In 2015, South Africa recorded its lowest annual rainfall since 1904. In the same year, Cape Town also recorded its highest temperature in the last 100 years at 42°C. The lack of rain and abnormally high temperatures ended up contributing to some of the worst fires the city has seen. Additionally in 2017/2018, the Western Cape experienced its worst drought in decades, threatening our water security.”
These observations are associated with a possible shift towards more frequent, unusual conditions in climatic variables (such as rainfall and temperature). With this in mind, I decided to investigate whether shifts in the rainy season characteristics (onset – start of the rainy season, cessation- end of the rainy season and duration) of the Winter Rainfall Zone (WRZ) are already apparent in historical rainfall data. Onset, cessation and associated rainy season duration have strong relevance for agricultural practices and water resource management planning. These features are of particular interest due to Cape Town’s reliance on water from rain-fed water supply dams and the fact that the Western Cape Province (WCP) services a vast agricultural hinterland.
There is little prior work carried out on this topic in the WCP hence, part of this investigation was to develop and implement a robust methodological approach to generate onset, cessation and rainy season duration data.
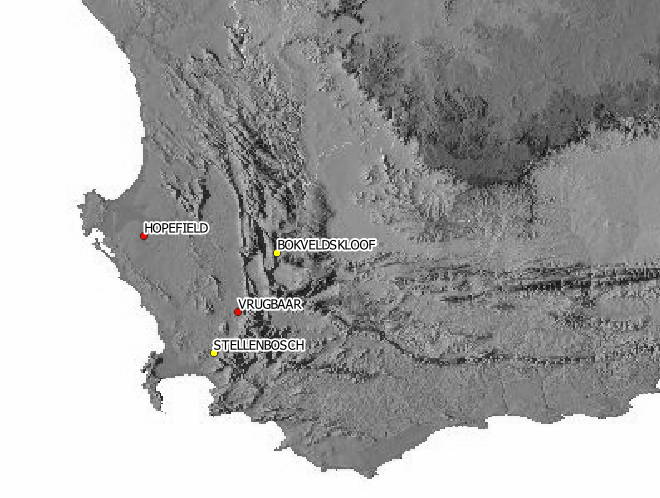
Historical rainfall data were sourced from four of the South African Weather Services (SAWS) rainfall stations: Stellenbosch (1978 to 2015), Bokveldskloof (1978 to 2017), Vrugbaar (1905 to 2017) and Hopefield (1908 to 2017). They were chosen based on the predefined location within the WRZ, presenting no significant data gaps, with more than 30 years of data and including years of the most recent 2015/17 Cape Town water crises.
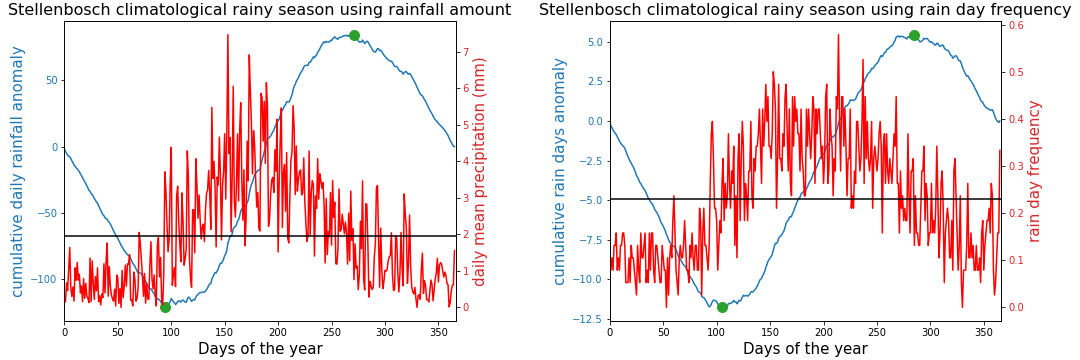
I applied a hybrid methodological approach that relies on defining exceedance thresholds to estimate onset and cessation dates for individual years, using percentage cumulative distributions (Odekunle, 2004). These thresholds were estimated as percentages of the year’s total in terms of rainfall amount and rain day frequency. The thresholds were derived from analyses of the climatology for each station by determining the inflection points on cumulative climatological anomaly distributions (Dunning et al., 2011).
Methods based on rainfall amount and number of rain days were implemented alongside each other to test whether Odekunle’s (2004) conclusion would hold for this study region. His findings suggests that, in Nigeria, onset and cessation dates derived using number of rain days are more accurate. It accounts for the influence of isolated showers that may occur before and after the rainy season that is responsible for producing false start and end dates.
Using Stellenbosch station as an example for illustrating the methods applied, below are the cumulative climatological anomaly distributions for the recent period 1978 to 2015. Red lines represent the daily mean precipitation (plot on the left) and daily mean number of rain days (plot on the right) for the 38 year period at this station. Blue lines represent the cumulative anomalies (anomalies are the daily mean values minus the annual mean of those values) The green dots represents the start (climatological onset) and end (climatological cessation) of the climatological rainy season (defined as the period with above average daily mean rainfall/daily mean number of rain days (averages indicated by horizontal blackline)).
Illustrated below, the climatological onset and cessation dates were then used to estimate the percentage thresholds (indicated by black squares (onset) and black circles (cessation)).
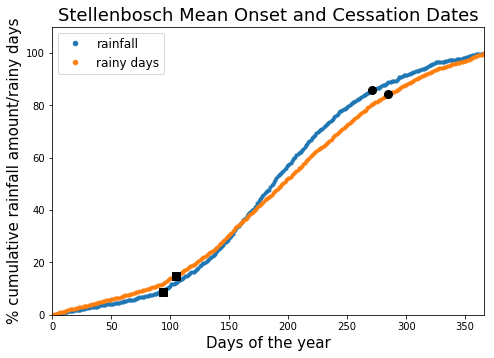
The rainy season duration was obtained by subtracting the cessation dates from the onset dates (dates were in the format of days of the year, not calendar dates).
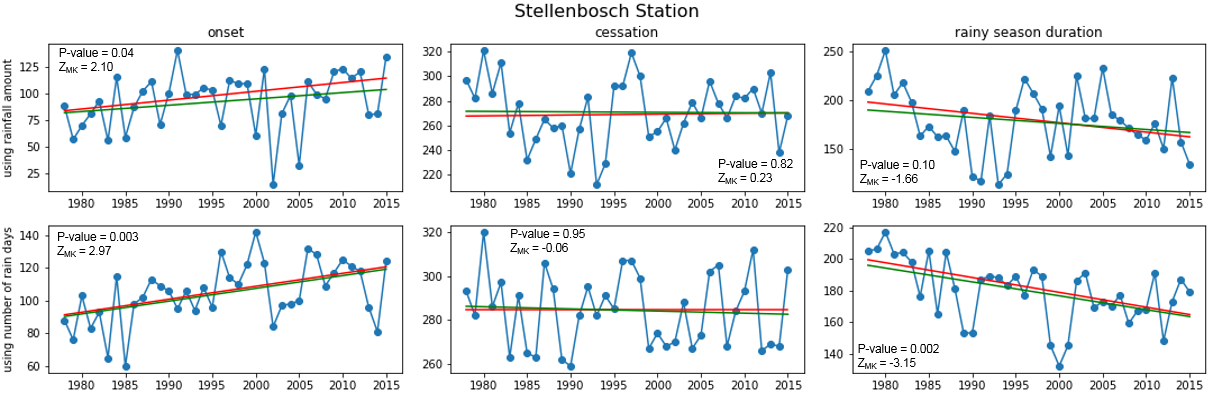
To avoid doing a rigorous normality test (due to time constraints), the non-parametric Mann-Kendall Trend Test was used to quantify trends. Theil-Sen estimator was used to visualise the magnitude of the trends because it is not sensitive to outliers and does not require the data to be normally distributed (as opposed to applying Pearson’s correlation with the ordinary least squares line).
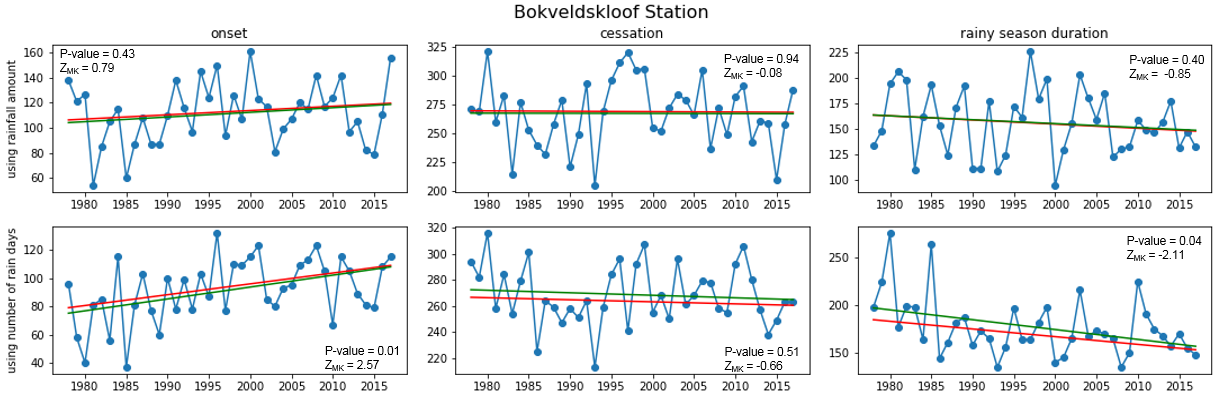
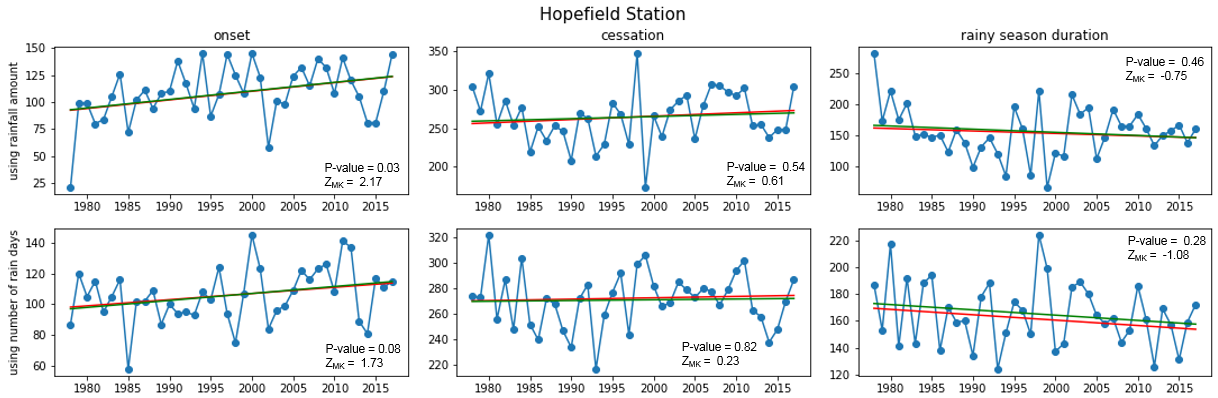
Below are the results for the recent period (1978 to 2015/17). Theil-Sen estimator (red line) compared to the ordinary least squares line (green). Results for each station represents the rainfall amount (first row) vs number of rain days (second row). Mann-Kendall Test statistic (ZMK) and p-value at 5% significance level.
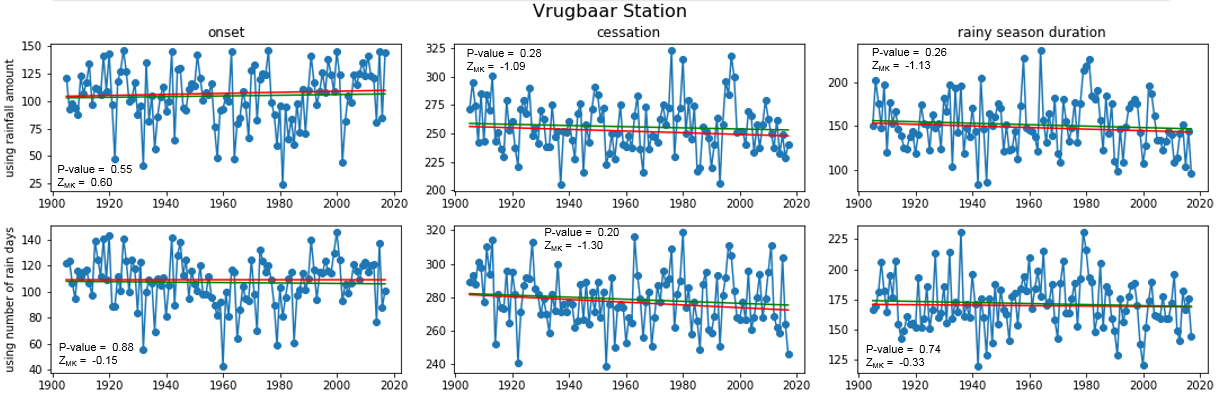
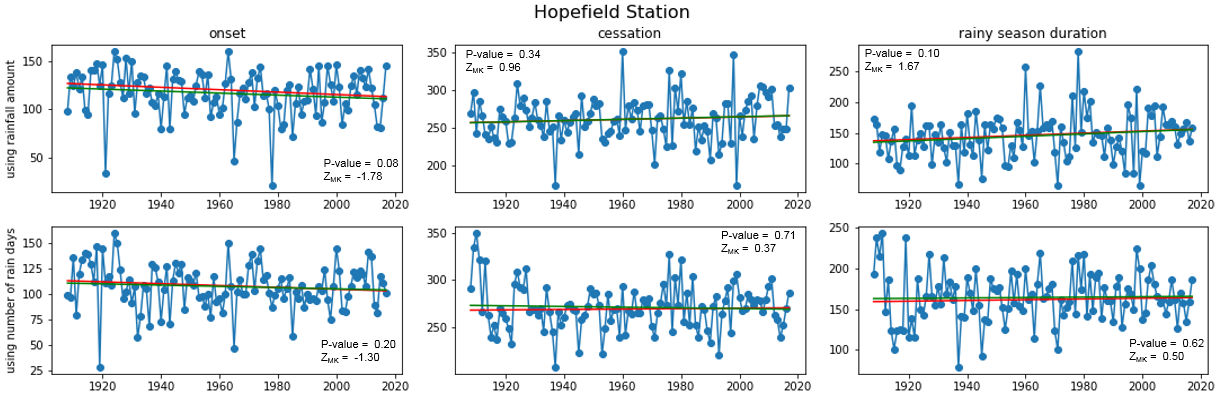
Additionally, below are the Long-term inter-annual variability for Vrugbaar station (1905 to 2017) and Hopefield station (1908 to 2017).
Below are some of the key findings for this study:
- There is a statistically significant recent trend (~ 40 years) in onset dates towards a later start to the rainy season.
- There is no significant trend for cessation dates.
- The trend in the onset of the season results in a trend towards a shorter rainy season, although this trend is statistically significant only at three of the analysed locations (Stellenbosch, Bokveldskloof and Vrugbaar).
- The recent trends do not agree with those in the long-term data. At the time scale of ~100 years, trends in the onset, cessation and duration of rainy season are not consistent between stations, weak and not statistically significant.
- Low p-values at 0.05 significance level suggests that the probability of rainy season onset and duration exhibiting no trend (null hypothesis) is very unlikely.
- The presence of outliers (false start and end dates) in both methods, using rainfall amount and number of rain days, suggests that neither one is more effective than the other for this study region.
- However, there is an overall consistency in trends between the two different methods (rainfall amount vs number of rain days).
- Therefore, results suggest longer dry seasons (peak water consumption period), shorter growing seasons for agriculture and a need to enhance rain water harvesting (as both groundwater recharge and surface water storage) to accommodate the observed shift in the rainy season and facilitate increasing water demands associated with population growth.
Mukundi Mukundamago
This is insightful. Thank you Neville for sharing on ACCESS mailing list.
Waarith Abrahams
Hi Jonathan, there is a consistent trend towards a reduced total rainfall for the rainy seasons exhibited at each station. However, these trends are not statistically significant.
Miché Moses
Very interesting article Waarith! Which other rainfall stations do you plan to include?
Jonathan Diederiks
Very interesting thanks, could the shorter rainfall season be offset by an increase in rainfall during that shorter rainfall season? to compensate for the shorter rainy period. So, is the amount of rainfall the same or is the shorter rainfall season also showing less rain?
Neville Sweij
Hi – thanks for this – this is very well aligned to the ACCESS research theme on the annual cycle and seasonality. I will disseminate this on our list.
Waarith Abrahams
Thanks Bruce! Stefaan and I are working on a publication alongside our other research. Once published you can expect to see a more detailed study (including more rainfall stations) in the publications page of this website. As for which journal, I still have to discuss with Stefaan and perhaps our more senior CSAG colleagues.
Bruce
Love this. So which journal is it being published in?