In early April, we posted a preliminary assessment of the remarkable series of rainfall events that affected the south-western Cape region from mid-February to late March. That turned out to be just the start of an extraordinarily long and intense rainfall season for the Winter Rainfall Zone.
Arguably the most severe storm of the season left a trail of destruction after the Heritage Day weekend. Here, I present some records for this Heritage Day cut-off low (COL)1, September 2023 as a whole and 2023 to date.
As I write this, the extreme rains have (mercifully?) given way to a remarkably dry and warm October in the south-western Cape. However, the peak cut-off low risk season for most of the Overberg and parts of the Cape South Coast (Western and Eastern Cape provinces) is generally October-November (see below), so not everyone is quite out of the woods for 2023 yet.
Rainy day records at Newlands
The City of Cape Town (CoCT) holds records of the number of rainy days per month at the Newlands Reservoir since 1913. This September equalled the 1948 and 1996 record of 19 September rainy days. Earlier, June 2023 equalled the 1962 record of 22 rainy days in the month.
September is generally a rainy and moderately wet month in the south-western Cape with an average of 12 rainy days in the month at Newlands, compared to 14 in July and August, 13 in June and 12 in May. However, total rainfall in September is almost 30% lower in September than May, indicating that September rainfall tends to be less intense. That pattern was repeated in 2023, with many days of light to moderate intensity rainfall, until…
The Heritage Weekend Cut-Off Low
As the Heritage Day long weekend (23-25 September) drew nearer, numerical forecasts identified a potentially heavy rainfall risk over the central Overberg associated with a COL that was expected to form from Saturday evening. The South African Weather Service (SAWS) consequently issued a press release. Hereafter, warnings were further elevated to level 9 (max: 10), as extreme rainfall predictions shifted further west, to where a very cold and wet winter left soils saturated and dams full.
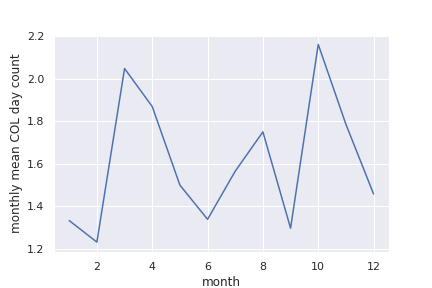
While the SAWS correctly noted that COL frequency and associated flooding rains in the Western Cape tend to peak in the transition seasons, historically, September has seen a markedly lower COL frequency than March, April, August, October or November (see figure 1). Furthermore, climatologically (in the long-term average) sea surface temperatures around the Cape reach a minimum during September, reducing the moisture availability from local evaporation. September storms therefore tend to be less wet than similarly strong storms at other times of the year. Yet this COL was extremely wet…
The type of COL that formed is known as a “deep COL“. Such systems with surface south-easterlies are known to be associated with extreme rainfall events, such as was also observed, for example, over 15-17 November 2013. Such a COL event is often referred to as a “Black South-Easter”. The associated weather conditions were certainly extreme, both wind speeds and rainfall totals.
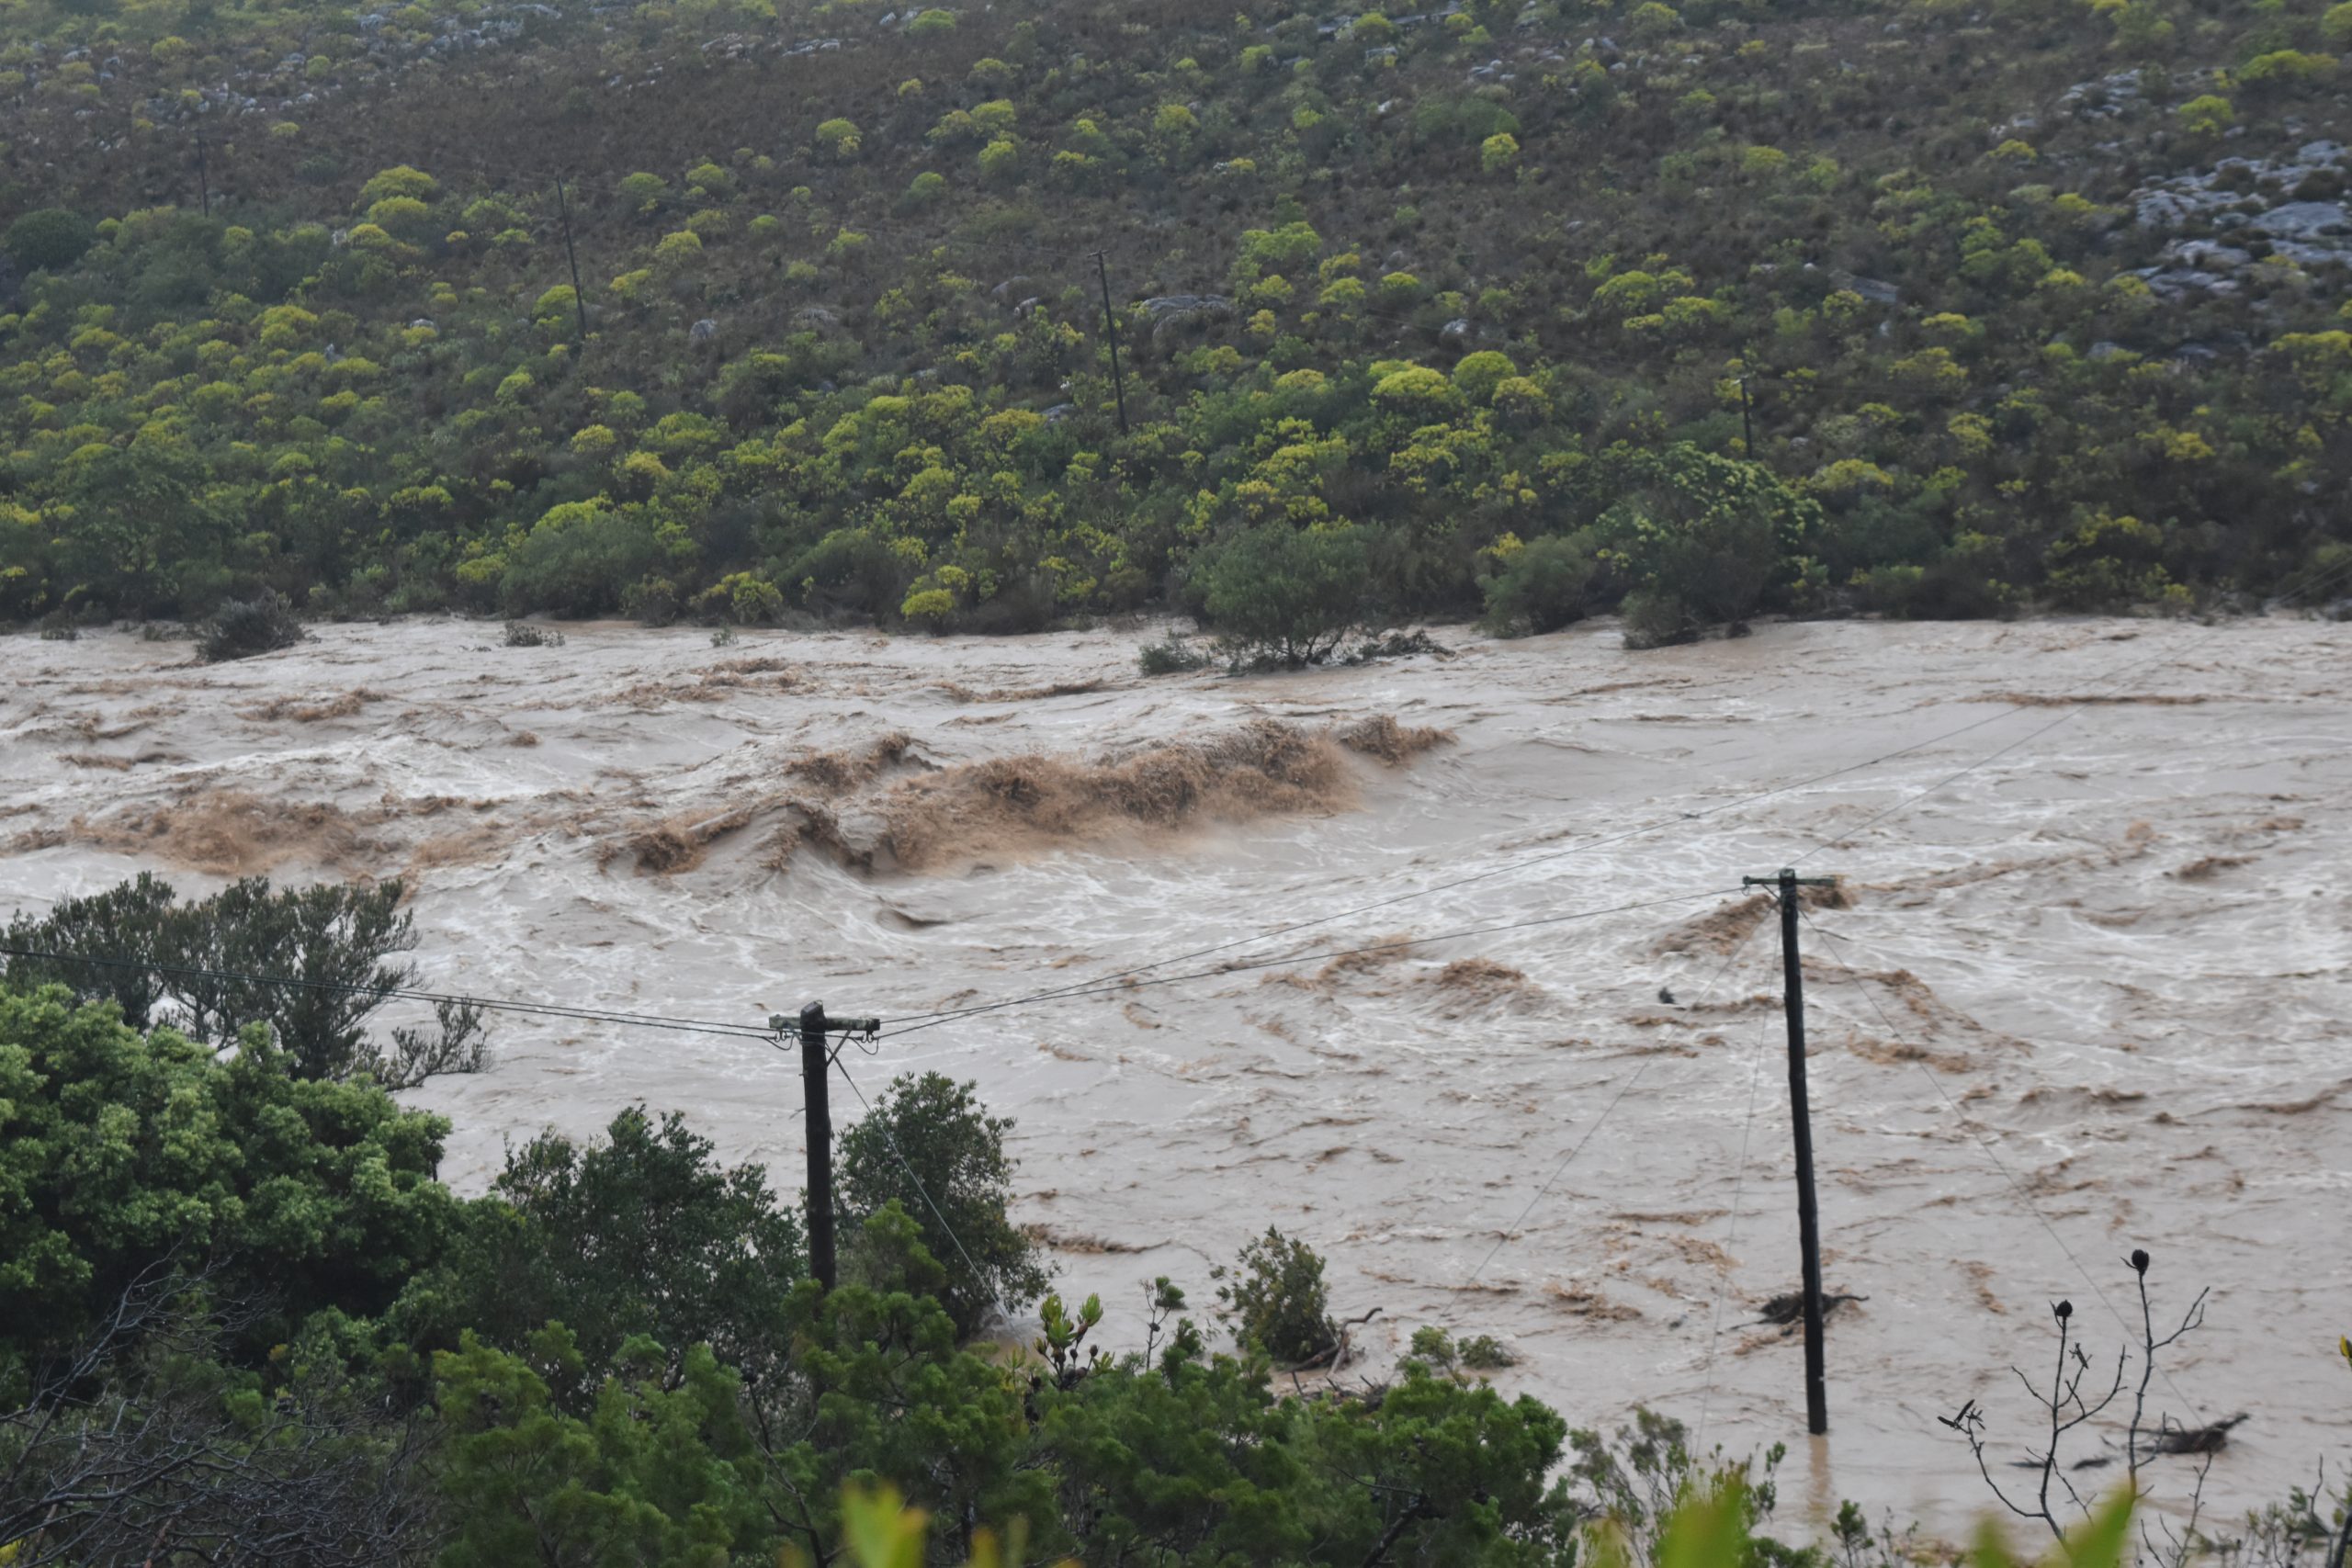
In terms of flooding, hard hit towns/suburbs/settlements include Sir Lowry’s Pass Village, Macassar, Mfuleni, Eerste River, Driftsands, Philippi, Strand, Botrivier, Stanford, Bredasdorp, McGregor and Franschhoek. Electricity and water infrastructure was severely damaged in places, leaving towns without water or electricity for an extended period. Many travellers were left stranded as roads back to Cape Town after the long weekend were washed away or flooded, a number of which will remain closed for months to come.
Most of the rain fell between late afternoon Sunday 24/09 and mid-morning Monday 25/09. This lead to very high rainfall totals for the official 24/09 24hr rainfall recording period (in South Africa, the reading for the 24th is taken on 8am the 25th). Spatially the southern Winelands, western and southern Overberg, Kogelberg and Cape Town City Bowl were hardest hit (meteorologically). However, heavy rain was seen from Namaqualand (Springbok and Nieuwoudtville saw record September daily totals > 45mm) to the Baviaans- and Langkloof areas, in the catchments of the Nelson Mandela Metropole’s dams.
Record daily and event rainfall
An exhaustive assessment of daily and monthly record rainfall totals is well beyond the scope of this blog, but a few records are worth mentioning. The 126mm recorded by SAWS (preliminary data) at Molteno Reservoir for 24/09/2023, is, in available records stretching back to 1887, the highest daily rainfall value for any month (there are long gaps in the record, though)! The event total was 142mm. SAEON’s Dwarsberg station above Jonkershoek recorded 280mm for this 24 hr period, which, as far as I know, is the highest total recorded by an automated station in the winter rainfall region in a standard daily period. The corresponding storm total was 393mm, at Constantiaberg Peak it was about 160mm. The Western Cape Department of Agriculture‘s Bredasdorp station recorded 210mm for the event, almost half the annual average rainfall of the town. In SAWS and DWS records back to 1878, only 4 monthly totals for any month have exceeded this number and no September has come close. Many other places saw their highest daily rainfall for September.
Monthly total records
The SAWS Jonkershoek station recorded 282mm for September 2023. In records for the lower Jonkershoek Valley stretching back to 1926, this appears to be a new September record, beating 270mm in 1930. The current automatic station at the Assegaaibos office, however, may be somewhat wetter than the old manual station across the valley at the Manor House. The SAEON Dwarsberg automated station’s September total of 726.2mm for 2023 narrowly misses the 728mm record set by the (generally wetter) manual Jonkersnek 17B station in 1957, coming in second in records (with gaps) since 1945. The 225mm measured at Molteno Reservoir also appears to be the highest September total in the Cape Town City Centre since records began, handsomely beating the 187.1mm in 1902 and 186.1mm set in 2008. Further analysis may uncover further records…
Soil moisture and streamflow
In effect, over the south-western Cape, where 60-80% of rainfall occurs in the cool months from April-September, there were two extreme events at different timescales: (a) the Heritage weekend COL, a weather time-scale event and (b) cold and wet weather over an extended period since since late February 2023. Cumulative rainfall totals along the western coastal belt have been near-record levels and average temperatures since March very low, with the near-absence of hot days (with the exception of 2 days each in early March and April and another 2 at at the end of August) most notable. This led to low evaporation and very high soil moisture.
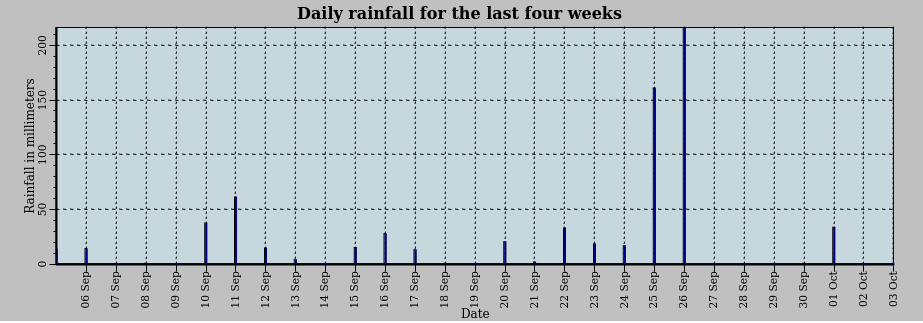
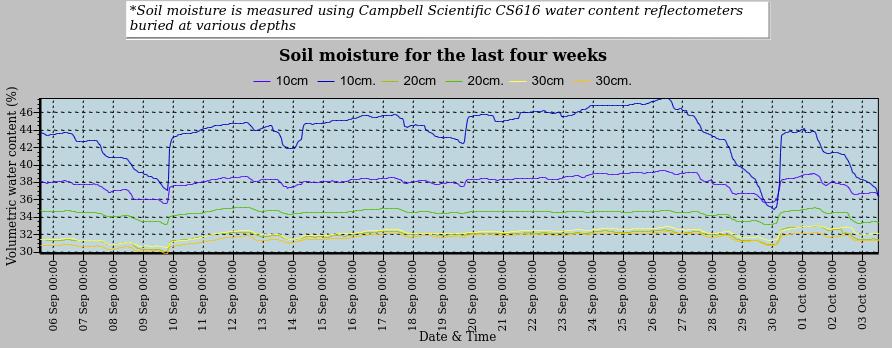
The extreme rainfall of 10-21 June, persistence of light rain and low temperatures through September and the consequently very high soil moisture levels and full dams meant that any subsequent heavy rainfall event carried very high risks of flooding. That is demonstrated by comparing the soil moisture and rainfall plots from Dwarsberg, Jonkershoek, above. Two berg wind events saw surface soils dry out quickly (9 and 29 September), but in between, moderate rainfall maintained soil moisture at high levels. When 400mm fell over the long weekend, soil moisture throughout the profile barely changed, suggesting that the soil was nearly saturated. Hence almost all the record rainfall went into streamflow, so that even more extreme flooding resulted.
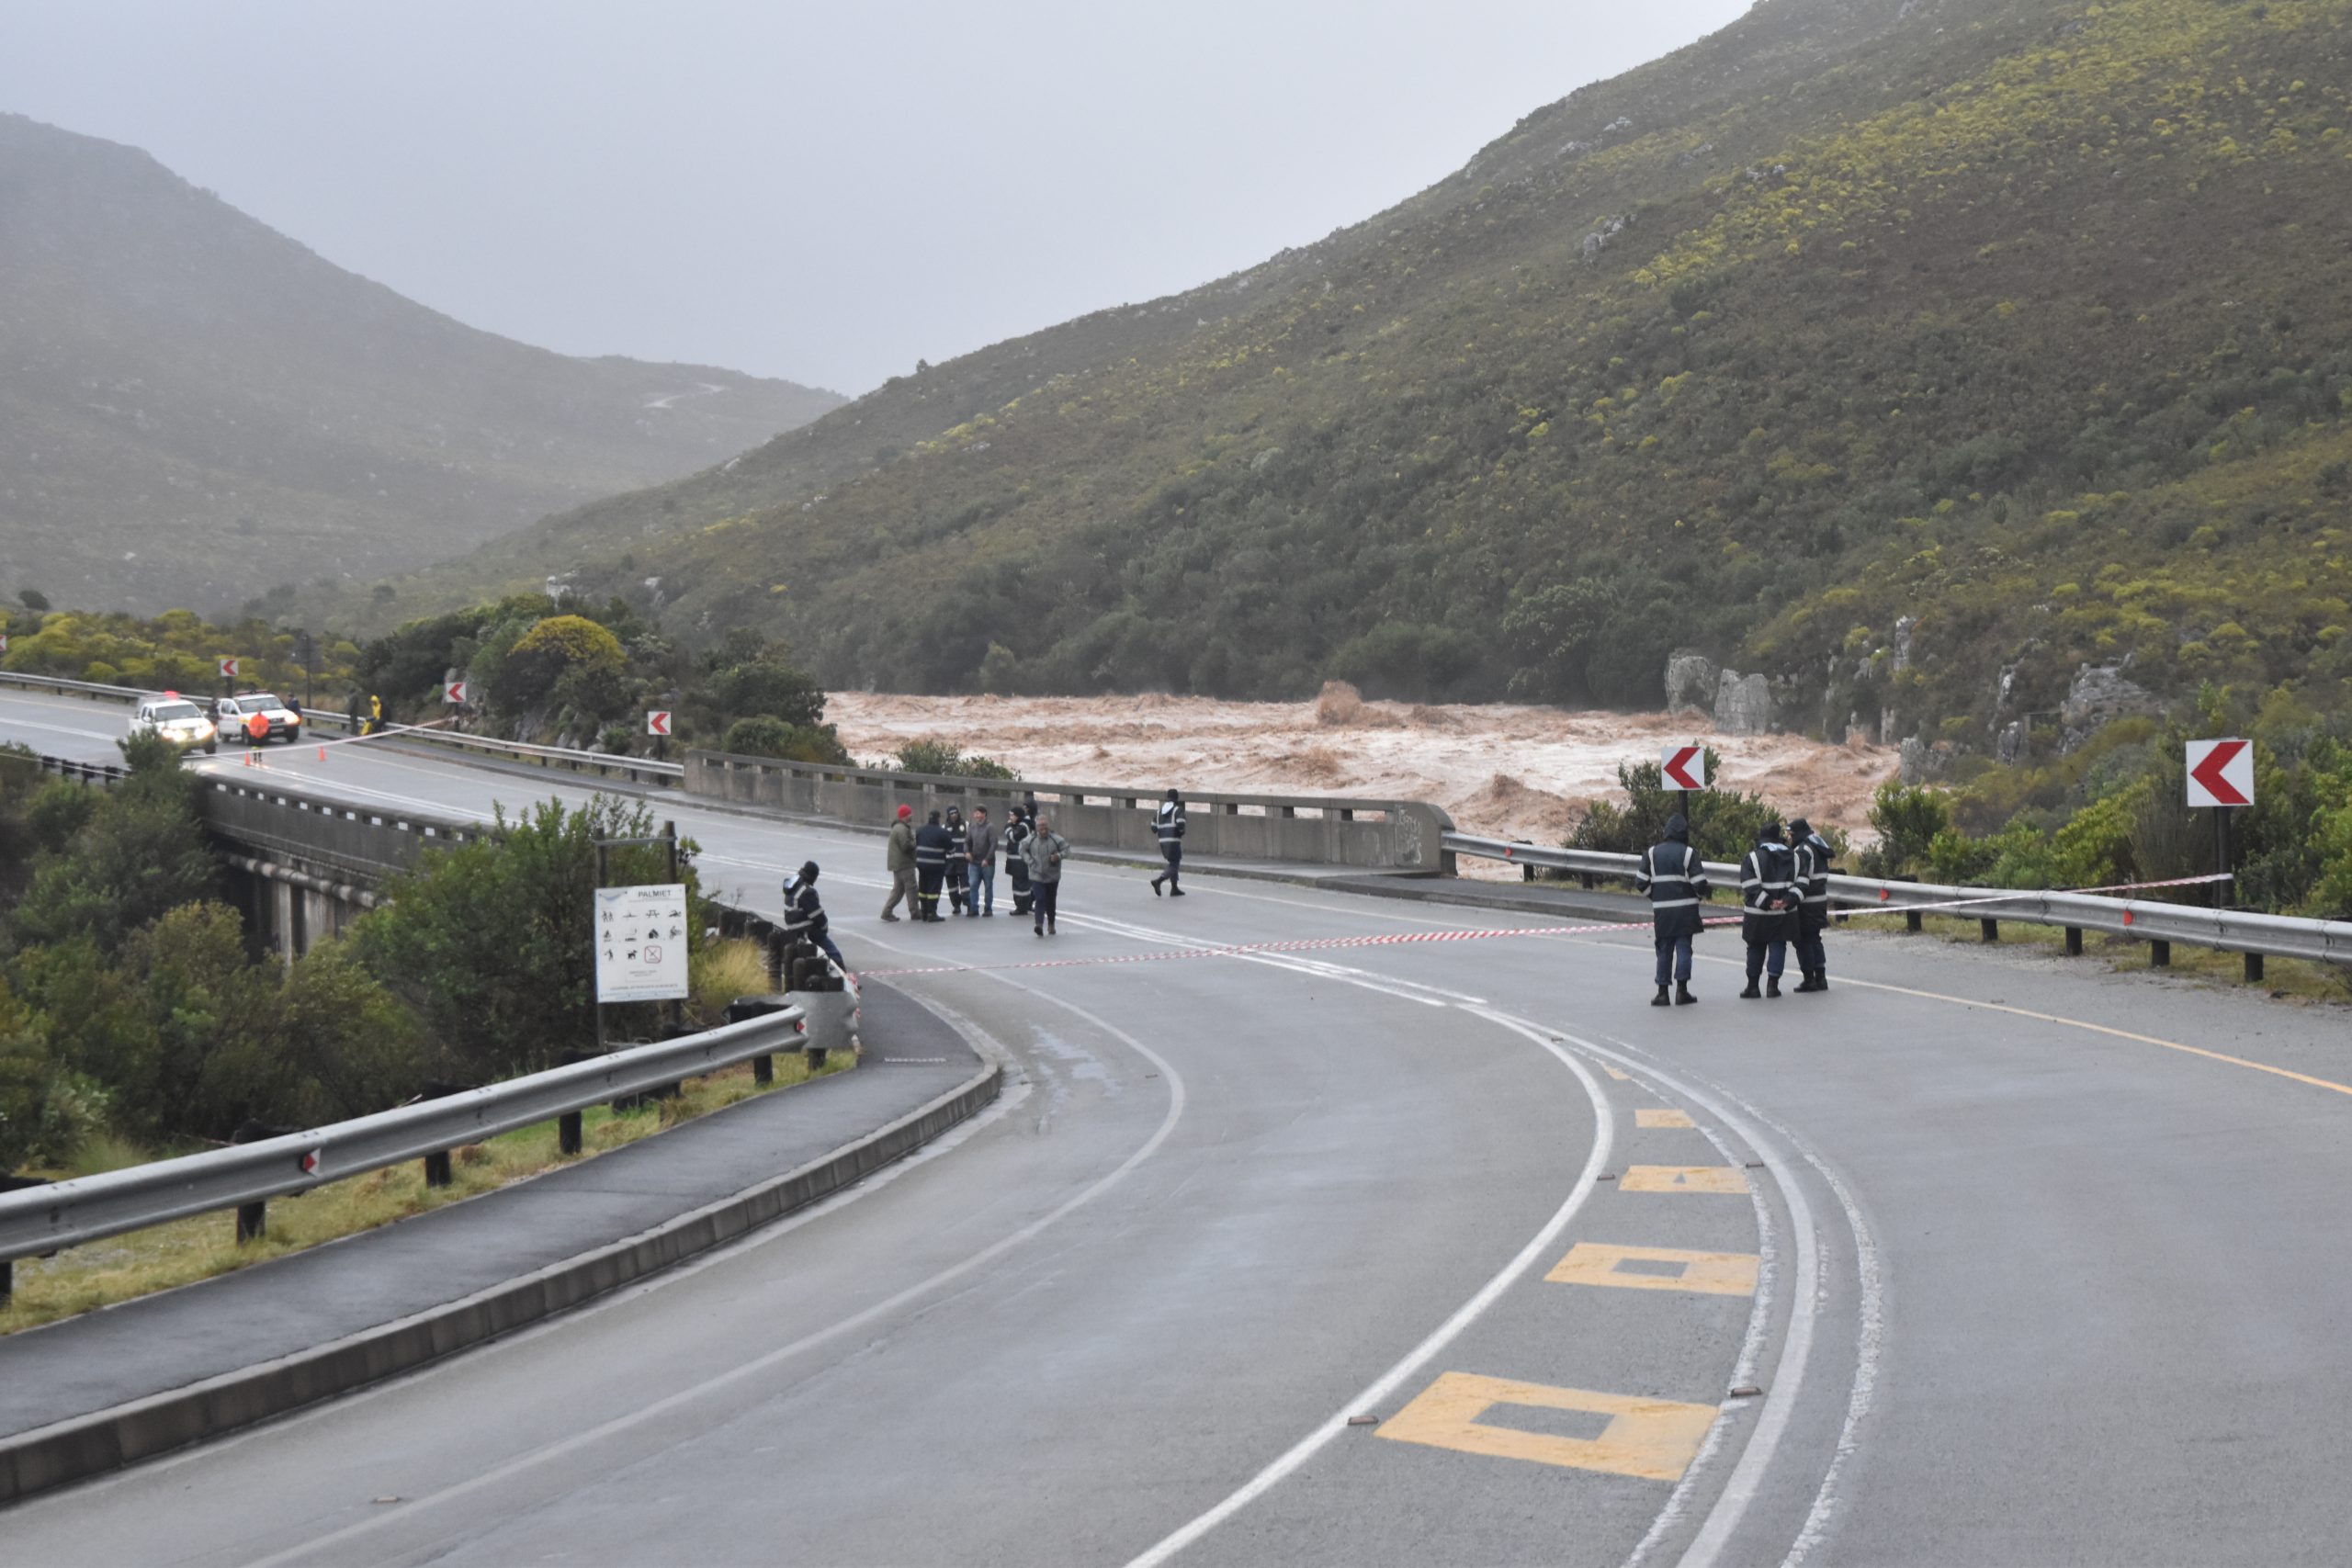
Just above the Palmiet Bridge near Kleinmond on the way to Betty’s Bay, which was closed after the storm, the Department of Water Affairs and Sanitation has a streamflow monitor that has been reporting since 1963 (see photos). Unverified data from this gauge indicate that the maximum 25 September flow height of over 3.5m was by some margin the highest flow on record, beating the previous record set during the Spring COL of November 2013, that also followed an extremely wet winter.
Climate change link?
Much has been written about possible links between this extreme winter—and the Heritage weekend especially—and climate change. The Western Cape government is certainly keen to emphasise a role for climate change in this event and inevitable future floods. They have gone as far as to dubiously label the Western Cape province South Africa’s most disaster prone.
Recent attribution work indicating an enhanced risk of extreme rainfall associated with Storm Daniel in other regions where climate change is expected to reduce total rainfall and increase drought risk (especially Greece and coastal Libya), has contributed to speculation that the same may hold in the Western Cape of South Africa. An initial study has even suggested a few extra mm of rain fell over the Heritage Day weekend due to enhanced atmospheric water vapour content driven by climate change.
However, the available evidence points a more nuanced picture which deserves a blog in its own right (one day!). A few key points, though, were made in June (so not covering the Heritage Day storm) by Piotr Wolski in response to the Daily Maverick:
[O]ur current understanding of the role of climate change in the winter rainfall region is that its predominant influence is towards making that region drier, with an increase in probabilities and severity of droughts such as the ‘Day Zero’ one. To my knowledge, we have not seen any convincing evidence towards an increase in the intensity of individual extreme rainfall events in the region and even less evidence of an increase in frequency or wetness of wet winters. Importantly, what we see now is not a single extreme event, but rather a sequence of rather high rainfall events (yes, some of them extreme) that make the winter (entire winter, but in particular the early June) unusually wet.
-Piotr Wolski, quoted in the Daily Maverick
This is important because through physics we know that anthropogenic climate change may manifest through an increase in extremely high rainfall at the same locations where we observe an increase in droughts or overall drying. But that reasoning cannot be translated to what we see in Cape Town this winter. To sum up – at first sight, this winter, although extreme, does not seem to be related to anthropogenic climate change. But dedicated analyses are needed to be more sure about this statement.
The evidence includes studies led by Babatunde Abiodun on extreme rainfall in African cities which concludes that Cape Town, uniquely, is expected to see fewer extreme rainfall events as the climate warms. Studies of Mediterranean-type climate zones globally also found the south-western Cape to be unique in not being expected to see increases in extreme rainfall. However, there was considerable inter-model spread; the IPCC AR6 suggests uncertainty regarding atmospheric river (AR) changes could be crucial.
The heavy rain that occurred during mid-June 2023 was associated with fronts that were accompanied with ARs. Please note, this will have to be officially confirmed, as ARs are not generally officially identified in real time in SA, but the recent systems bear strong resemblance to systems previously identified as such in work led by researchers from UCT Oceanography. ARs involve large amounts of moisture being transported, in our case from Amozonia (!) and the Brazilian coast, in narrow “fillaments” that can cause very heavy rain when they are strike mountain chains perpendicular to their transport. The 12-13 June 2022 floods were also associated with an AR, although that rainfall was more extreme on the low lying areas, whereas in 2023 the mountains bore the brunt of the very moist system.
Most extreme winter rainfall in the Cape Town catchment region occurs with ARs. Future projections suggest that the amount of moisture available for ARs may increase with increased sea surface temperatures around Brazil (due to climate change). This could lead to heavier rainfall around our mountains, especially in the near-term while fronts are still relatively frequent. On this topic Blamey et al. (2017) conclude:
[M]idlatitude atmospheric water vapor content is expected to rise in a warmer climate due to an increase in saturation water vapor pressure with air temperature, as governed by the Clausius–Clapeyron equation (Held and Soden 2006). This has the potential to result in increased water vapor transport through ARs (Gimeno et al. 2016). The link between increased AR activity/intensity through climate change and local flooding has already been projected for some regions, such as California (Dettinger 2011), Great Britain (Lavers et al. 2013), and western Europe (Ramos et al. 2016). Given the results highlighting the impact ARs have on heavy regional winter rainfall events, this implies, all else being equal, that there may be an increased risk of flooding events in the southwest region of South Africa in the future through changes in AR activity. This again highlights the need to better understand the factors that influence the formation, frequency, and intensity of ARs in the South Atlantic. Given the close association between these ARs and the winter rainfall region of South Africa, this could potentially play a key role in understanding any local changes in the context of global climate change.
Blamey et al. (2017): http://journals.ametsoc.org/doi/10.1175/JHM-D-17-0111.1
Global climate models used for projections may not pick up these extremes, since their resolution tends to be too low to “see” the steep topography of the Boland, Winterhoek and Cedarberg. Further research into this is thus needed.
Whether research findings for Cape Town and its catchments also hold for other parts of the Western Cape is even less clear. In the Overberg, Little Karoo and Garden Route, most extreme rainfall events are associated with intense COLs, including those occuring in May and Nov 2021, Nov 2008, Nov 2009, Nov 2013, Jan 2014, Mar 2014 and Aug 2006. The areas around Somerset-West, Worcester, Hex Valley and Stellenbosch are also susceptible to COL flooding, as witnessed with some of these events. The only study I know of considering future projections of COLs over southern Africa concluded that a decreased frequency of such systems was most likely to occur. Previous reports have concluded that COL-related flooding is sufficiently common in parts of the province that it should not be regarded as an “extreme event” for even relatively extensive COL flooding to occur. However, the September 2023 flooding in the south-western Cape was certainly highly unusual if not unprecedented. Further work is needed, so watch this space!
1Following the approach taken by SAWS and most other researchers in South Africa (as far as I can tell), in this discussion I regard any cold-cored closed low at the 500hPa-level, not embedded in a mid-latitude trough, as a COL; see also Abba Omar and Abiodun (2019).