Summary
An initial look at preliminary March 2023 rainfall data for Table Mountain suggests it was the wettest March in the instrumental record of the “Mountain in the Sea”, going back as far as 1893! This appears to have been mostly the result of four cut-off low systems forming along the west coast during the month with associated surface lows allowing for significant moisture convergence into the south-western Cape.
Background
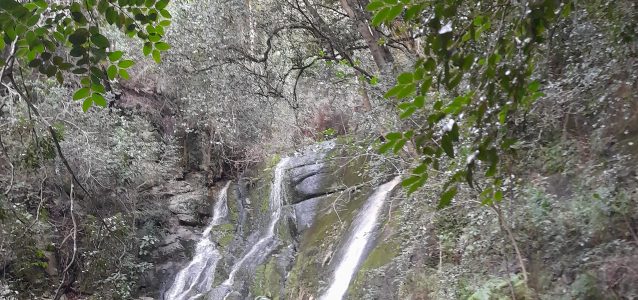
Many Capetonians will have noticed the unusually wet and cool weather we’ve had over the past 7 weeks or so. Those who’ve ventured into the surrounding mountains may have been surprised by the abundance of water, in sharp contrast to the dry stream beds seen during spring last year (2022). So, absolute Cape Town weather data geek that I am, I had to go and dig a bit deeper…
The data
Monthly rainfall records for March 2023 from various institutions are now available. And the figures for stations around Cape Town are nothing short of astonishing. In the table below I compare March 2023 readings to long-term average values (where available) for March and for June, the climatologically wettest month of the year throughout the south-western Cape.
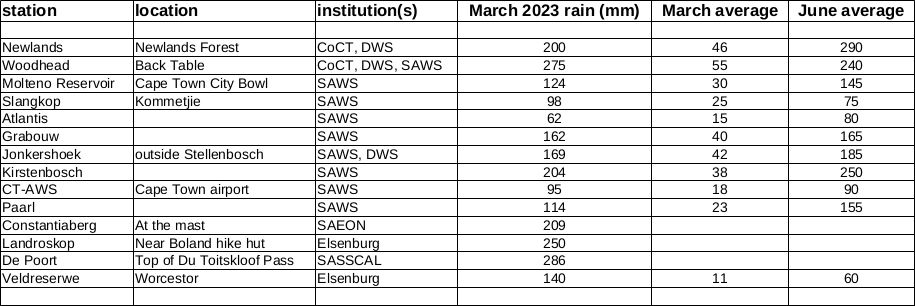
Unfortunately, Observatory March 2023 data were not provided by the South African Weather Service (SAWS) in their preliminary monthly bulletin. This station has records dating back to 1841! The South African Environmental Observation Network (SAEON) Dwarsberg station in Jonkershoek, the wettest reporting station in South Africa at the heart of the Cape Town dam catchment, also has a lot of missing data for the month, but at least 300mm fell here during March 2023.
Here I focus on two stations on Table Mountain, Newlands and Woodhead (both covered in Piotr Wolski’s regularly updated tracking of seasonal rainfall around Cape Town). The Newlands station is located next to the reservoir in Newlands Forest, the Woodhead station is on the southern side of the dam of the same name situated on the Back Table. Both stations are very wet, with average annual rainfall totals over 1500mm. Over the whole year, Newlands is somewhat wetter, but during the warmer months (October–April), Woodhead tends to get more southerly orographic rain, especially with cut-off lows (COLs) and thus receives a substantially smaller part of its rains in the winter half-year (April–September; 75 vs 81%).
Woodhead rainfall data are held by the South African Weather Service (SAWS), the national Department of Water Affairs and Sanitation (DWS) and the City of Cape Town (CoCT); DWS and CoCT both have Newlands records. At CSAG, the following data are held: intermittent daily SAWS Woodhead readings over 1908–2018, monthly CoCT Woodhead readings over 1893–2017 and daily CoCT records from 2000-present (updated from the weekly CoCT dam levels report). Similarly, there are monthly Newlands CoCT records from 1907 and daily data from 2000. DWS data are publicly available, daily from 1980 and monthly from 1954 and 1959 for Woodhead and Newlands, respectively.
Rainfall records
As shown in the table above, CoCT March 2023 rainfall totals 199.7mm at Newlands and 275mm at Woodhead. For Newlands this is by far the wettest March in the CoCT monthly data. The DWS data corroborate this for 1960–present. Considering the four driest and warmest months in Cape Town (December–March) as the summer period, only December 1909 saw more monthly summer rainfall than this March.
At Woodhead, the CoCT data indicate March 2003 as the wettest March with 278.7mm (just!). However, SAWS and DWS data indicate 160mm and 156.7mm for this month. Looking at the corresponding daily data from the three sources and comparing them to surrounding stations, there appears to have been erroneous CoCT recordings on at least two days. This includes a total of 87.1mm not in the DWS and SAWS records, on a day when no surrounding station recorded more than 10mm. These errors explain the large differences between the monthly totals from the three institutions for the same station. An automatic procedure is used to select which institution’s data to use on each day that there are differences. This gives a monthly total of 160mm. This reading is also (much) more consistent with recordings at surrounding gauges for March 2003.
Using this reading of 160mm for March 2003 means that the wettest March in records back to 1893 at Woodhead is March 2023. And by more than 100mm! In fact, no summer month since at least 1893 had exceeded 270mm before this March (January 1901 with 253mm and December 1906 with 264mm come closest).
Notable totals were also observed elsewhere. The De Poort station (on the Du Toitskloof Pass, near the top) saw more rainfall in March this year than during any month in 2022. This includes June 2022, during which the 13-14 June storm saw record-breaking single day rainfall figures at many locations. At Landroskop in the heart of the dam catchment area, since the COL event that started on 14 February this year, 400mm has been recorded. The Agricultural Research Coucil’s Umlindi Newsletter indicates that February 2023 rainfall over most of the south-western Cape was in the top 10% of Februaries on record.
So it should be clear that this March–and indeed the period from mid-February to end March–was an extreme period in Cape Town’s summer rainfall record, stretching back over a century. What weather system(s) were responsible for this extraordinary statistics?
Weather systems
Two recent papers from Dr. Wade de Kock’s PhD project indicate that heavy summer rains over Cape Town’s catchments are more import and than we tend to think. Cut-off lows (COLs) and atmospheric rivers (ARs) are the systems primarily responsible for such events. This again appears to apply in 2022- 2023.
Weather systems: February
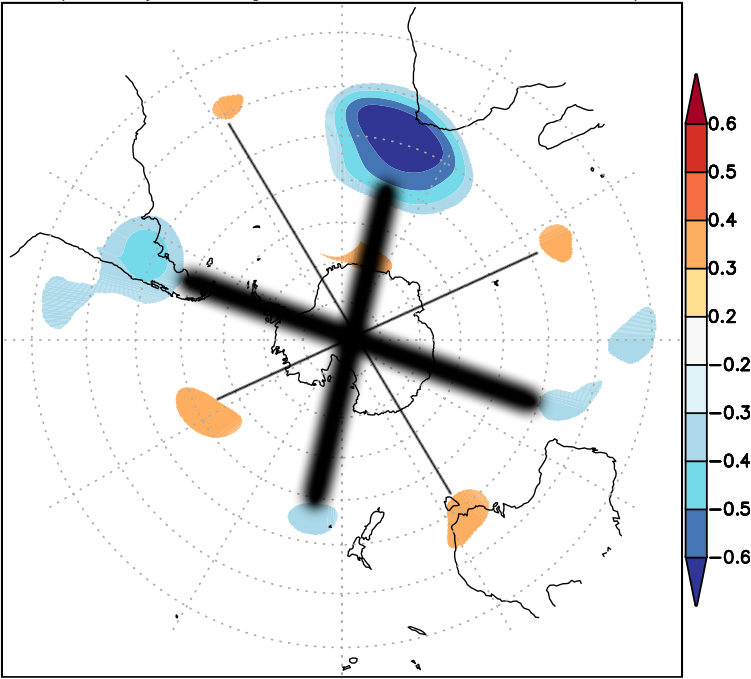
After a two week period of unusually persistent warm to hot and humid weather at the beginning of February, a COL formed on 16 February just offshore of Cape Town. It had broken off from a prominent, slow-moving, hemispheric zonal wave-4 structure. That’s a mouthfull! It refers to a pattern that occurs in the Southern Hemisphere’s circulation along a latitude circle around the globe, where there are four warm highs and four cold lows roughly equally spaced around the pole. An example of such a zonal wave-4 structure associated with wet autumns in Cape Town is included below. At the surface, the mid-February COL was associated with strong, moist south-easterly flows (the winds in Cape Town were intense and the Table Cloth almost permanently in position). This brought orographic rain along the southern mountain belts, including above the Steenbras and Theewaterskloof dams.
As the zonal wave-4 pattern grew in amplitude again, a strong cold front developed on 19 February. It was drawn very far north of where such systems usually occur in summer. It drew large amounts of moisture from the subtropical waters off South America along what appears to have been an AR. This storm produced more than 90mm of rain in 8hrs at multiple stations in the dam catchments and 40-50mm over Table Mountain. It also led to extensive wind damage and some nuisance flooding in Cape Town. A much weaker front then passed over a few days later.
Weather systems: March
After a warmer and calmer period, another slow-moving high amplitude trough spawned another COL off the Cape Town coast on 4 March. A second COL formed from the next passing trough late on 5 March. This time, these deep COLs were accompanied by a pair of surface lows and a heat trough in the interior, which led to the convergence of large amounts of tropical moisture from the north (drawing moisture from the Mozambican Channel and Angolan Current) and subtropical moisture from the Agulhas Current to the south-west. This led to quite heavy (for Cape Town!) thunderstorms.

The first low then moved southward and acquired more conventional mid-latitude cyclone characteristics. Two front-like troughs extended north-west and north-east of the low, the western one bringing further light rainfall over the south-western Cape.
The second COL, however, remained almost stationary for some days, bringing further convective rain before being displaced by a moderate cold front on the 9th of March and a weak one on the 11th of March, both of which dropped yet more rain.
A brief warm period with off-shore flow driven by a west coast trough followed. Along the southern mountains, though, this system led to light convective showers on the 15th with the intrusion of moist surface easterlies.
The most unusual system of the month followed over the weekend of the 20th. A cold-cored upper low (COL-like) associated with a surface cold front moved rapidly north-eastwards, before turning back south-eastwards off the coast of the Northern Cape. This is very far north for an extra-tropical surface low to go at any time of the year. The cold front disintegrated and light rain occurred along the west and south coasts. The system then followed a similar path the the 4th of March low as a trailing front-like feature brought further light rain in the south-west.
This system was immediately replaced by yet another COL off the central west coast forming over a strong west coast trough on the 22nd. This system and accompanying surface low converged large amounts of southward-flowing tropical moisture along much of the South African West Coast, with widespread thunderstorms along the main mountain belts the result.
Two further weak cold fronts closed out the month.
Weather systems: December
Earlier in the summer, December 2022 was the wettest month of the year at many drier locations in the winter rainfall zone (e.g. Redelinghuys and Vredendal), despite these locations on average receiving more than 75% of their annual rainfall in the winter half-year. This was associated with two intense cut-off lows along the west coast and western interior, with surface lows, moisture convergence from the north and south-east and large-scale convective rainfall.
Conclusion
The extreme monthly rainfall totals are particularly noteworthy in the context of observed and projected drying in summer and autumn in the south-western Cape, including long-term March drying. The anomalous conditions observed raise many questions.
What underlying drivers led to four COLs forming in roughly the same area, all being deep, in only a few weeks? Was climate change involved in making conditions favourable for deep COL development more likely? Or perhaps in providing plentiful moisture that produced heavy rains when the systems did develop? And why so many fronts before the rainy season, when we expect frontal rain to decrease with human-driven climate change?
At this stage, these remain open questions. They represent an opportunity to deepen understanding of Cape Town’s climate in the present—and likely pathways into the future.
1 Data are from SAWS, SAEON, CoCT, Elsenburg and the Southern African Science Service Centre for Climate Change and Adaptive Land Management (SASSCAL) Weathernet. The full names of institutions abbreviated in the table are provided above or in the text of this section, together with links to where the data were sourced, if available; this CSAG tool is also used. All rainfall values are provided in mm, to the nearest mm. Averages, provided where available (nearby) time series allow long-term means to be calculated, are not all for the same period and should be regarded as reasonable estimates only.
Peter Johnston
Hi Diana, Many streams will flow off Table Mountain during and shortly after the rain, especially if the ground is dry and hard, not much sinks in and it runs off very quickly. In some cases, however, the water is immediately absorbed into the soil where there is vegetation and none runs off. This is probably the case with that stream.
During the rainy season, as it rains more, the ground gets softer, more water sinks into the soil and the groundwater then adds to the flow and the streams persist during the dry periods. Then you will find many streams flowing well into summer.
Diana Studer
Yesterday the stream that runs down the mountain across Boyes Drive to St James was absolutely dry. Why is there no runoff from all that rain?