On the 18 of January 2019 a low pressure system developed on the southern coast of Mozambique as the convection brought rainfall to Inhambane province. By 20 of January it was classified as tropical depression and moving northward in Mozambique channel in direction of Zambezia province . As it moved northward it gained more energy as it encountered warm and sea surface temperature and the tropical depression gained more energy and with winds between 63-89 km/h and it was labelled as moderate tropical storm and named Desmond on the 21st January. It did not reach winds high enough (118-166km/h) to be classified as Tropical Cyclone. So this was not a tropical cyclone but the first storm of the 2018-2019cyclone season in Mozambique. On the 22nd January, Desmond made landfall and the rain and storm surge caused floods in the low-lying city of Beira.
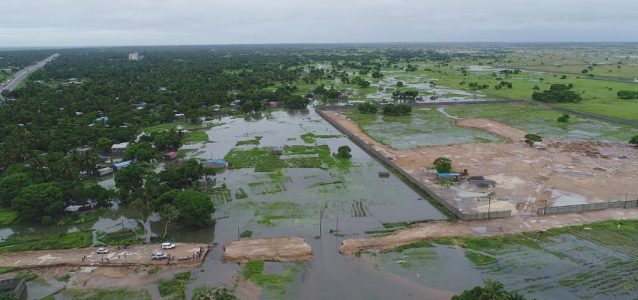
Images below show the extent of the floods caused by the compound event off rainfall (more than 250 mm in 24h) and the storm surge. What we see in these photos is definitely a result of an atmospheric event, but overall impact of that event will depend on the vulnerability of the population and levels of government actions. That’s a story for another blog, however, and here I will stick to the climate and weather.
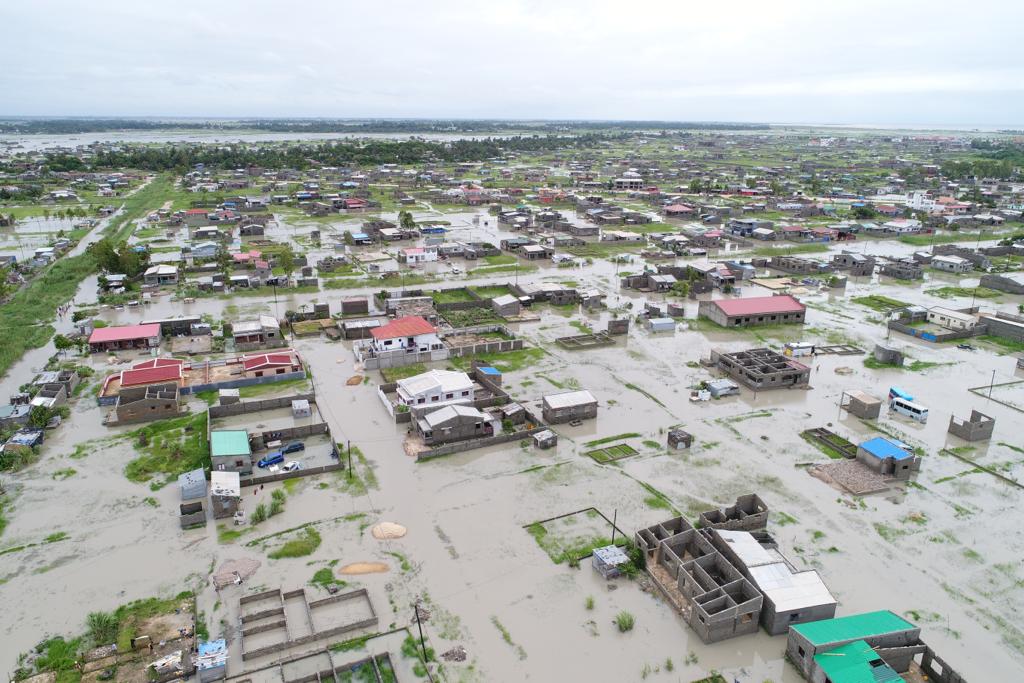
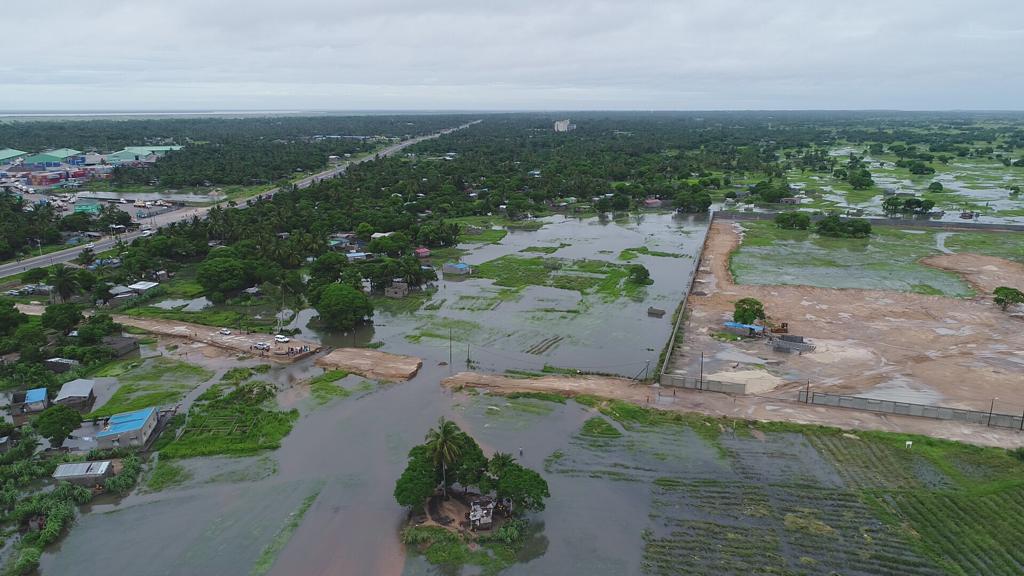
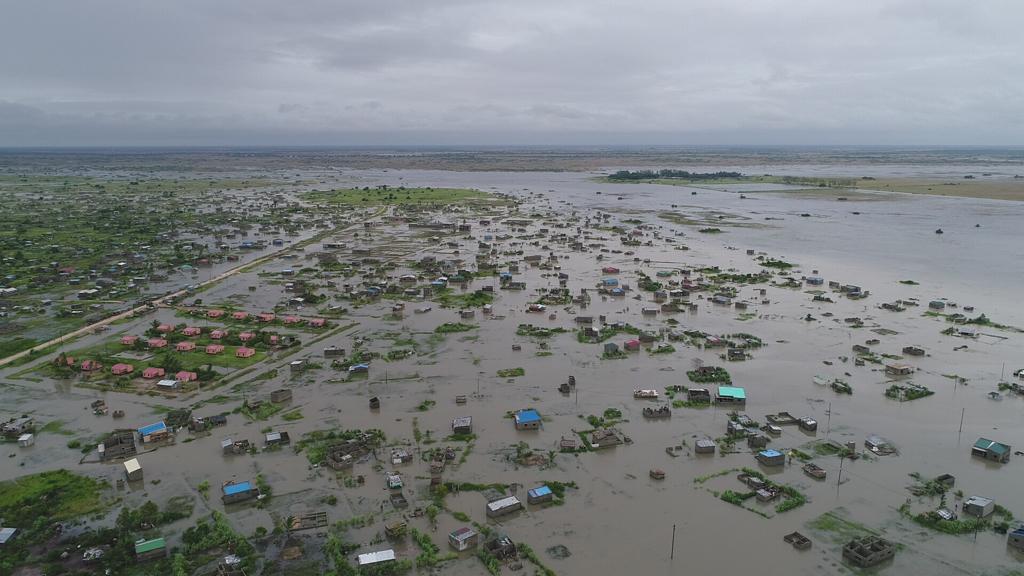
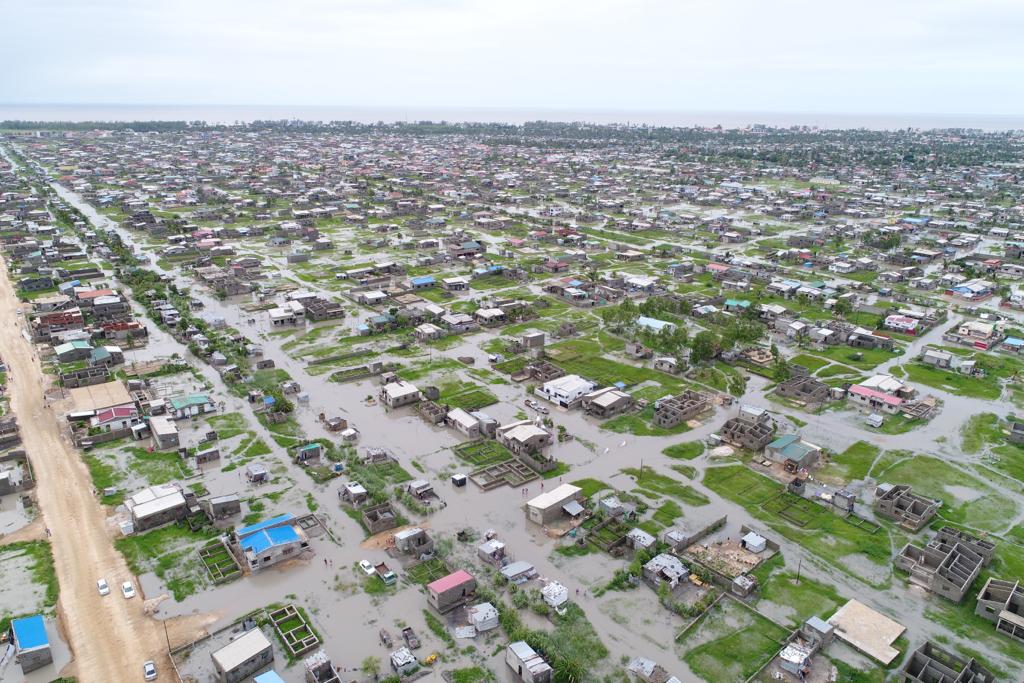
Pictures source: Antonio Beleza, CENOE, 23/01/2019
Since in the future, the intensity of such storms are likely to increase due to global warming, we need to have a good understanding of atmospheric processes leading to extreme weather events such as Desmond, and we need to work towards improved predictability of such events at shorter (daily) and longer (monthly to seasonal) time scales. Motivated by this, I decided to setup one single experiment with the UEMS-Weather Research Forecast Model (WRF) over a domain covering Mozambique. The model downscales the Global Forecast System (GFS) from 0.5 degree (~50km ) into 15km. This is a short-term model simulation that gives forecast of atmospheric conditions at every hour up to 42 hours ahead, or how the forecasters call it, with lead time of 42 hours.
The figure on the left shows the evolution of the system as simulated with the model initialized on the 20-01-2019 at 6am UTC (i.e. 44 hours before the event). The figure on the right shows the trajectory of the system at local time, ie, UTC+2. The dots represent the position of the center of the storm, expressed by the lowest atmospheric pressure.
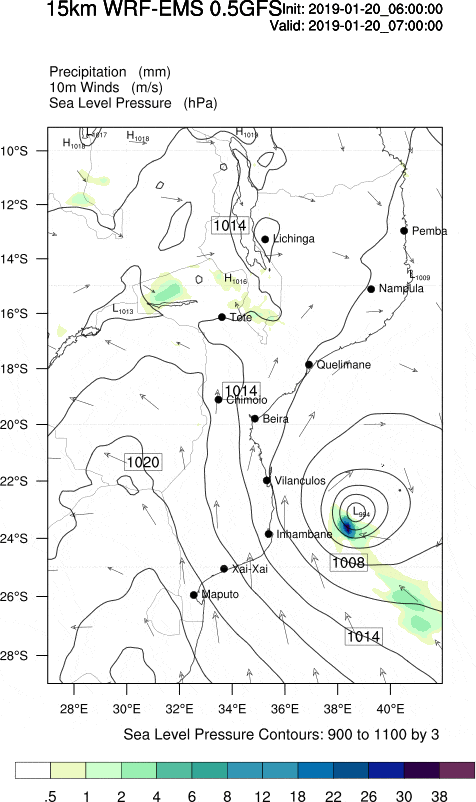
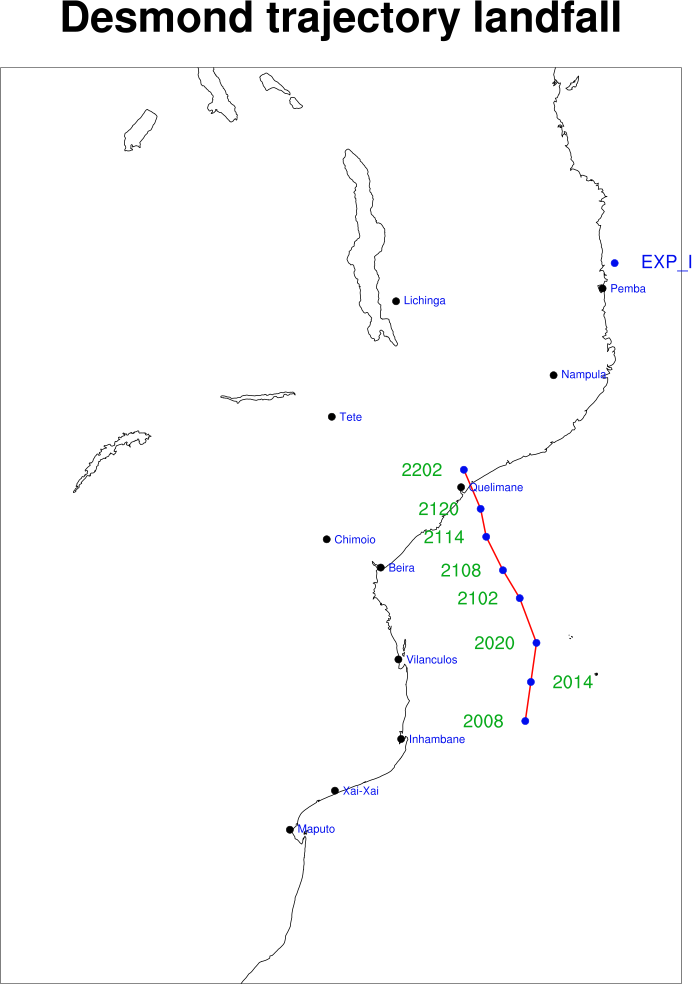
Figure 1. Movement of the system (left) and trajectory with date and hour in green and capitals in blue (right)
The figures below are the same as the ones above, however the model was initialized on 21-01-2019 00 am UTC i.e. 24 hours before the event. This run showed more rainfall over Beira around the 00 UTC compared to the first one.
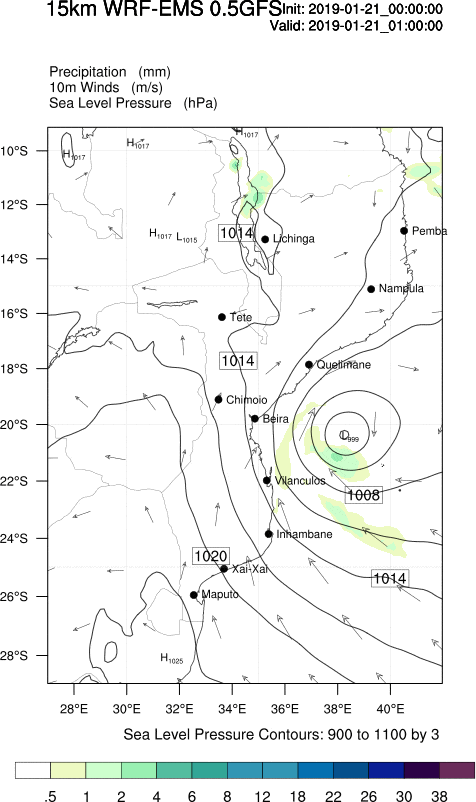
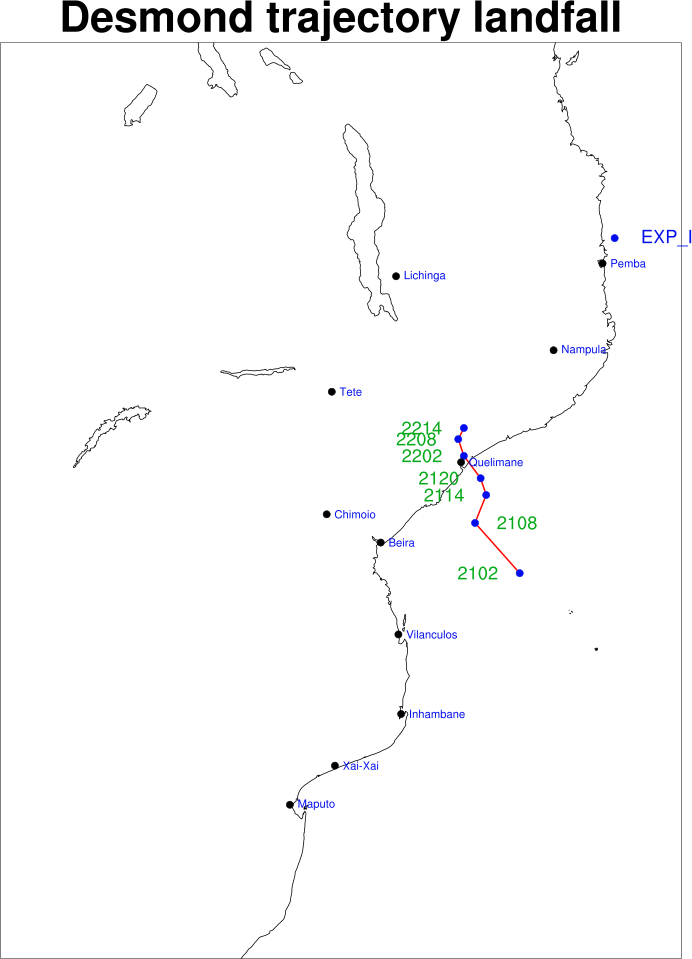
Figure 2. Same as above but with run initialization 44 hours before the event
So far so good. Our forecast definitely captured the storm. It captured realistic amounts of rainfall. However the landfall of Desmond was actually at ⅓ of distance between Quelimane and Beira on the map, over Chinde district, while the forecast puts is slight north of that city. In fact, the first of the forecasts shown in figure 2 on the right, got the position of landfall better than the first one. This is surprising because we would expect the forecast with shorter lead time (i.e. the second one) to be a better one. Why is this not the case? Perhaps it is due to the use of only one setup (or sets of parameters) of the model? And I happened to choose the setup that does not capture all the regional processes well? Ideally one should experiment with different parameterizations and or different boundary layer schemes and test which one is better. So far I figured that this configuration doesn’t work for tracking the trajectory of low pressure systems. Next steps are to run the model with increased resolution (will it improve the result?), different combinations (more data to analyse!) and to see what works best. However, only 24 hours in a day and other postdoc activities make it difficult to do it but my master plan has yet to be realized. So far these results are pretty good and the results can be found in this link (http://web.csag.uct.ac.za/~izidinep/wrfforecast/moz/prec/prec.html). I try to update as frequently as possible and automation is coming soon and replace me in updating the website (which also need to be re-designed)! So stay tuned…
And thanks to Piotr Wolski for helping me writing this blog.