In 1938 Guy Callendar published a paper, “The artificial production of carbon dioxide and its influence on temperature” and showed that the world temperature has increased at an average rate of 0.005°C per year during the previous 50 years and linked these changes to carbon dioxide (CO2). Since then it has been estimated that human activities have caused approximately 1°C of global warming. And this warming is likely to reach 1.5°C between 2030 and 2052 if mitigation strategies are not implemented[1].
Earth’s warming trends continue making 2019 the second warmest year on record since 1850 [2].
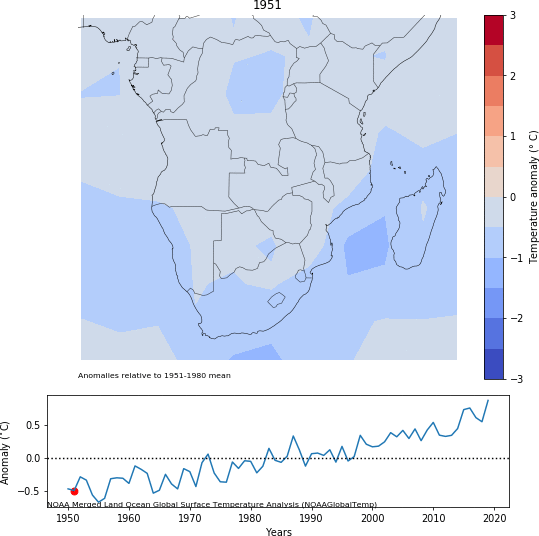
Sub-Saharan Africa is no exception. The region’s surface temperature has been increasing at a rate faster than the global mean temperature. The graph below illustrates the change in surface temperature relative to 1951-1980 average temperatures. Dark blue indicates areas cooler than average. Dark red indicates areas warmer than average.

Data source: http://berkeleyearth.org/about-data-set/
Two-thirds of the warming has occurred since 1975, and the past decade has been warmer than the previous.
Increases in temperature are only part of the story. For instance, tt can have large impacts on water resources. Since 2015 southern Africa has been experiencing lack of rainfall leading to water stress and food insecurity. With continued increases in temperature climate related risks are expected to be higher.
Bellow is an animation showing the changes in space and time.