This blog is an extended version of the article published in GroundUp
The nature of Cape Town’s water crisis remains a hotly contested issue. There is drought, of course. But there are also possible other reasons brought up in the public discourse, particularly in the social media, such as population and water demand growth, unreported agricultural use, invasive species sucking out water in catchments, poor planning and mismanagement of water supply system, and lack of foresight in development of new water sources. Are these significant contributors to the shortage of water? It’s really difficult to say without dedicated, comprehensive analyses. But facts are few, opinions plenty.
In that public discourse, fortunately, nobody seems to question the drought. It is in principle indisputable. What is being questioned is the magnitude or severity of that drought. It is questioned, because it has important implications. To simplify tremendously – if the drought was (actually still is) mild, then it should not have resulted in a major water crisis, and perhaps indeed the crisis is man-made. If it was severe – well… then it’s just a bad ticket on the climate lottery, and all the other factors mentioned above may, or may have not aggravated the water shortage, but would be very unlikely to have caused it. The issue is obviously socially tense. It wedges between authorities and citizens. Between those who institute water restrictions and those who have to bear the brunt of them. But as usual, facts are few, opinions plenty.
So I decided to have another look at the facts. So how severe was the 2017 drought? I have attempted to answer that question earlier. But that attempt was based on very limited data, and was carried out well before the 2017’s rainy season has even finished. Now I have a more comprehensive dataset, which gives me an opportunity to perform a more robust and objective assessment.
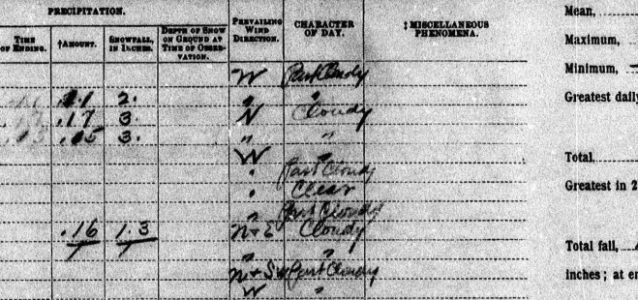
There are a number of rainfall stations that measure rainfall in the vicinity of WCWSS dams, and data for them are available from the Department of Water and Sanitation data website.
Unfortunately, not all stations in that dataset have good rainfall record – there are numerous gaps, and the availability of the record through time varies. This is illustrated in this figure:
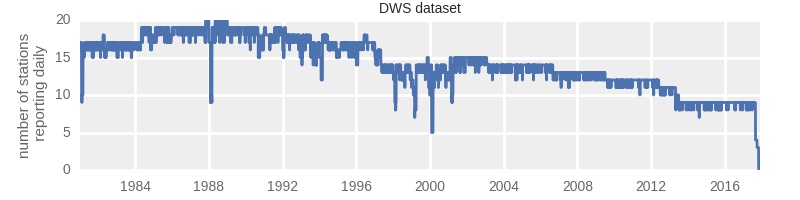
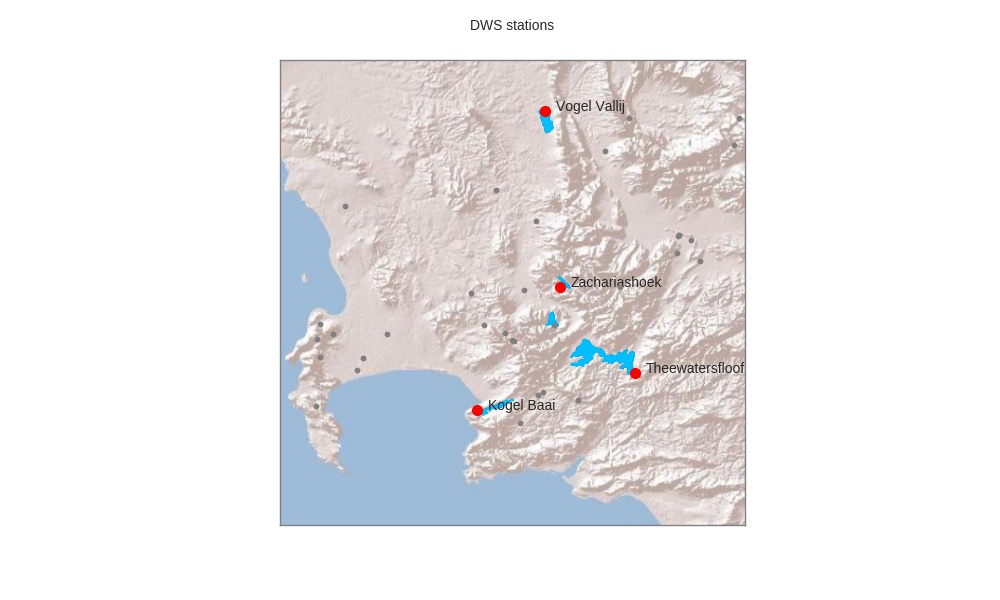
From that, it looks like there are nine stations for which data are available in the recent years. However, only four of those stations are located in the region of the WCWSS dams, have no significant gaps in the entire 1981-2017 period, and no systematic errors. Those stations are: Vogel Vallij, Zacharashoek, Theewaterskloof and Kogel Baai:
and this is how annual rainfall was at these stations during the period 1981-2017:
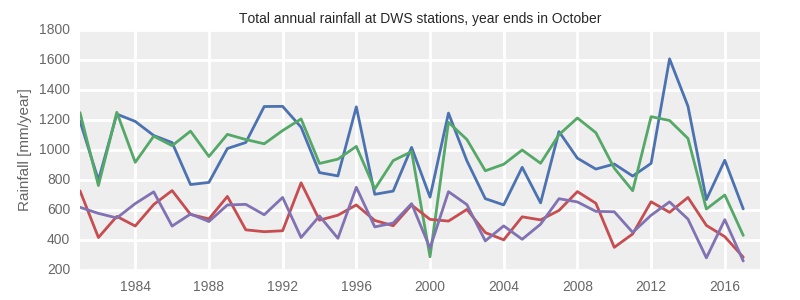
Note that the year in the above figures is taken to be between November and October. This is because October is more or less the end of rainy season, and the last month when an increase in dam levels may be recorded. Also, because at the time of writing this, data are available only till October 2017. Putting the end of the hydrological (or “water”) year in October allows me to use the 2017 data without estimating rainfall in November and December.
From the figure above it is clear that rainfall of 2017 was low. Only rainfall during 2000 was comparably low. However, the 2017 state of WCWSS dams is not just a result of low rainfall in 2017, but also of relatively dry previous years. If one calculates averages over 2 to 4 years the following picture emerges:
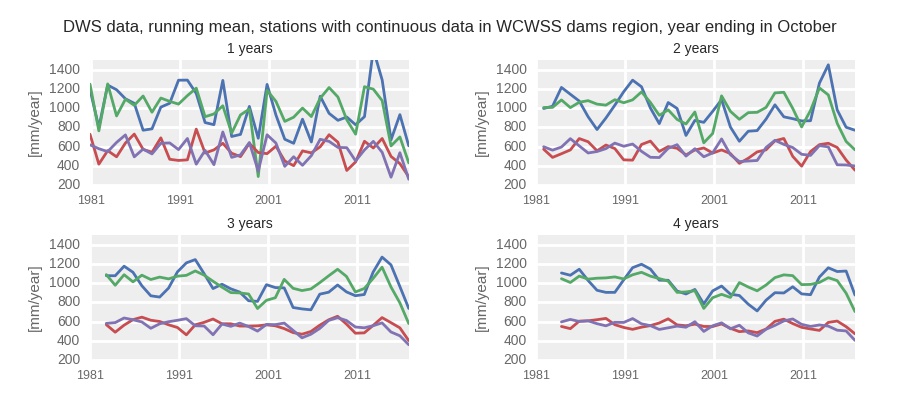
From this it becomes clear that patterns of temporal variation of rainfall at individual locations are somewhat similar, although not identical. Years of 2015-2017, 2010-2011, 2003-2005 were generally low rainfall years. Years of 2012-2014, 2007-2009 were relatively high rainfall years. Also, the level of the 2017 rainfall in relation to previous years differs between locations. At some locations a single year rainfall in 2017 is indeed the lowest since 1984. But at some it is not. For the 2-, 3- and 4-year totals, the situation is similar. Obviously, there is some variability between the stations, and perhaps some errors in data play a role too in creating station-to-station differences.
To make the analyses more robust, I calculated a simple average of the data of individual stations, and created the moving average plots for that composite series:
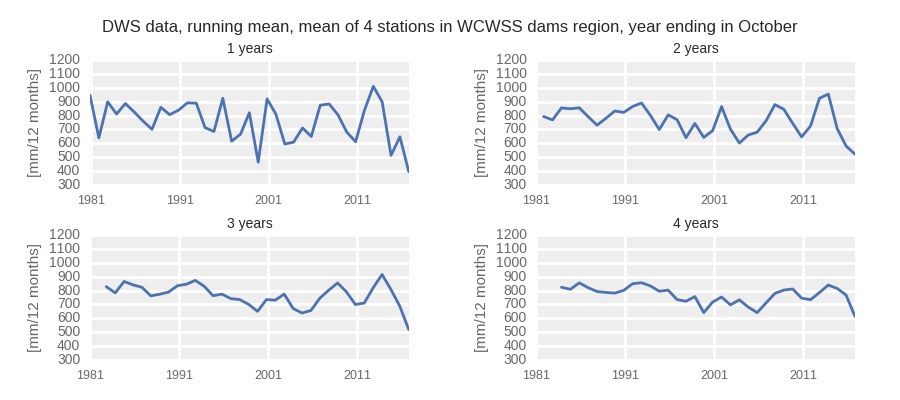
That simple average may not express the true rainfall pattern that affects the dams. For that, one would need a much denser rainfall network. But at least it does take care of possible inaccuracies in individual stations data. By taking the average, one is making a “democratic” decision rather than one based on possible “prejudices” of a single station.
The plots of average rainfall tell a consistent story: 2017, as well as preceding 2-, 3- and 4-year average rainfall in the region seems to be the lowest since 1981. What it means is that the 2017 drought was at least as rare as once in 36 years.
But looking at the last 36 years is not enough. We know that before that there were droughts too – notably in the 1920s and in the 1970s. We need to compare the current drought to the old ones. Can we go further in time?
The DWS data do not span further back. But data from another source do. The rainfall data from South African Weather Service (SAWS) for some stations in the Western Cape go as far back as late 1800s. (As a university researcher I have access to these data, but they are not publicly available, so I cannot give a link here. Sorry). Unfortunately, there isn’t any overlap between the DWS and SAWS rain stations, so we cannot simply extend the record of the four stations used above. I need to repeat the analyses on the entire SAWS dataset.
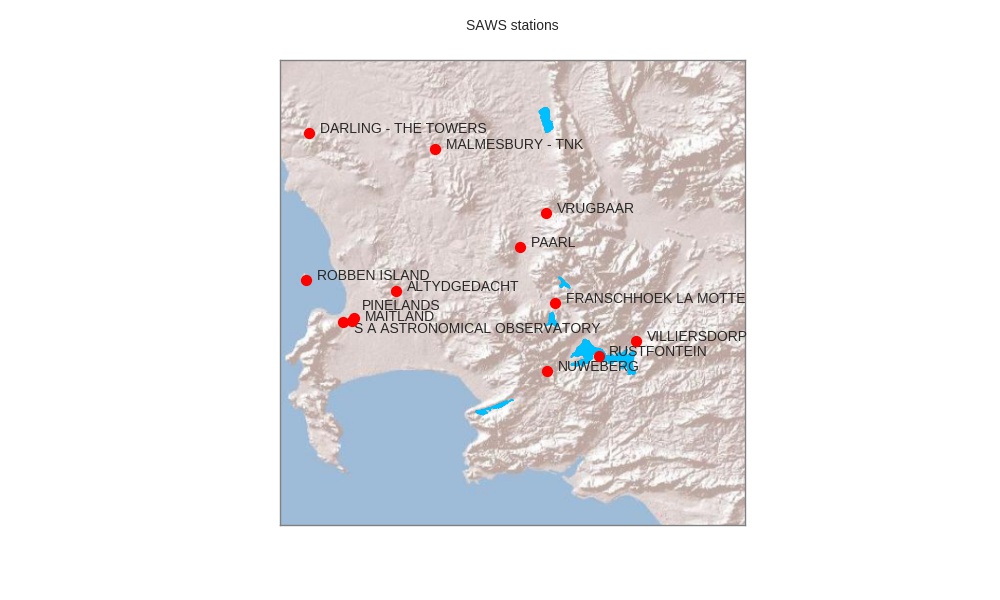
There are about 96 stations in the region that SAWS have data for. Unfortunately, only 13 of those have long-term data, i.e. data starting about 1933:
Similarly to DWS stations, the SAWS stations data are not always continuous. This is illustrated in the figure below:
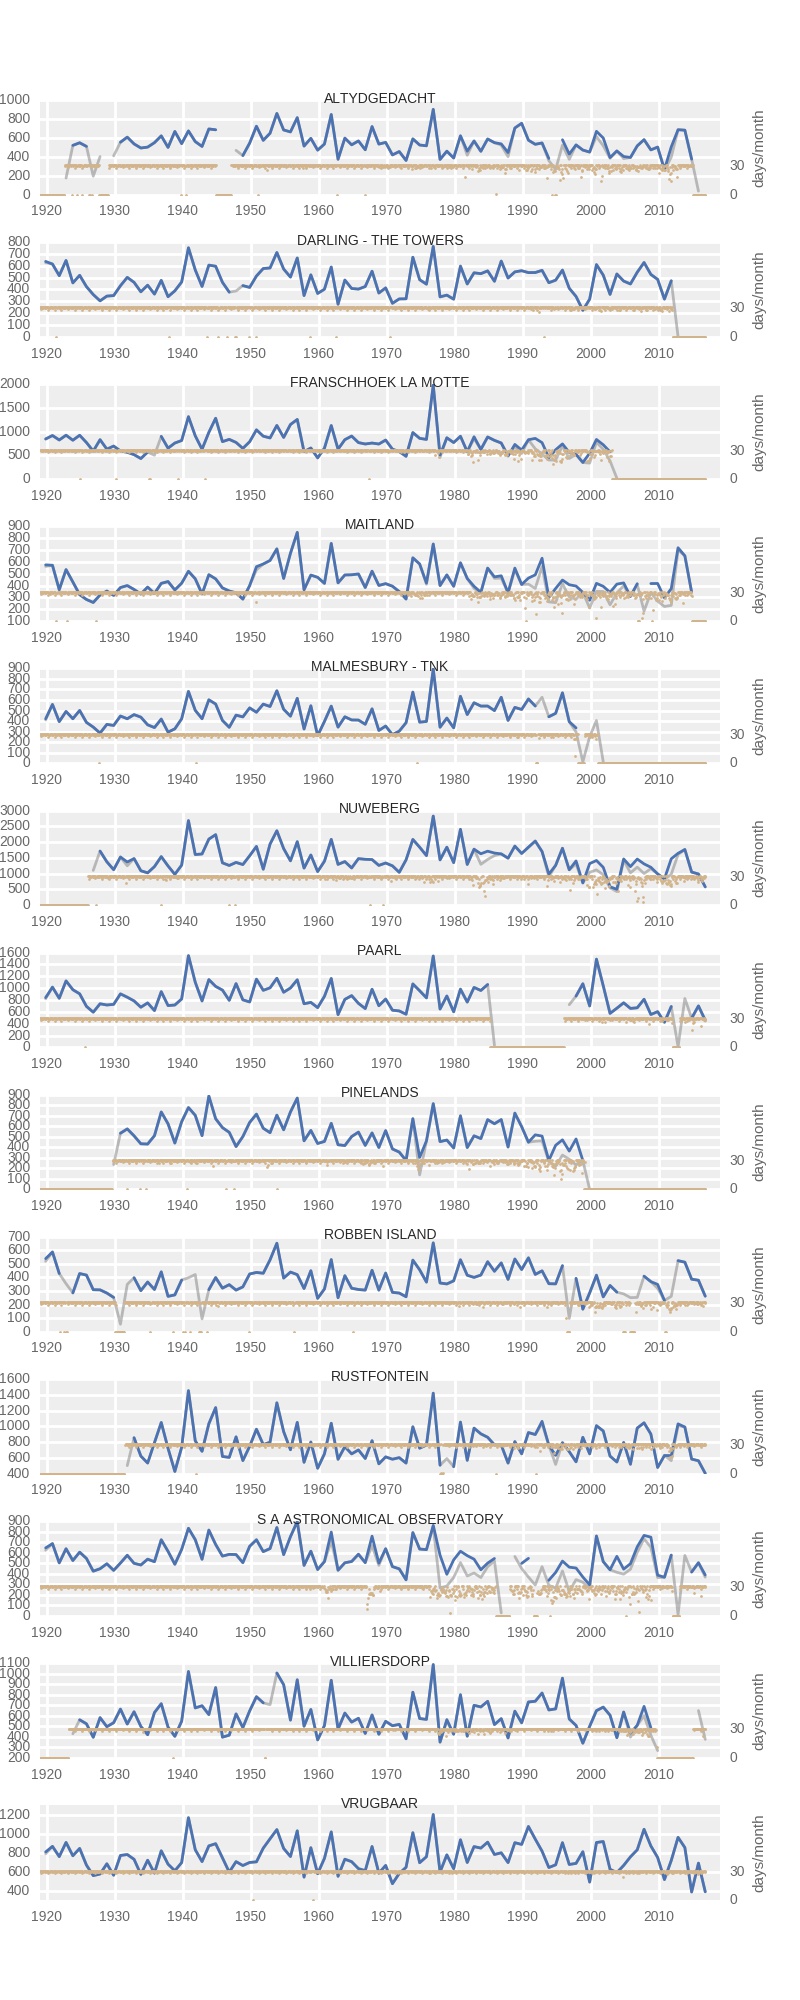
The figure shows annual totals as calculated from raw data (in grey), as well as when data are screened for missing days and months and gap-filled (in blue). Additionally, I plotted number of valid data-days per month (in green). What the above figure illustrates is the common problem with observational station data – it’s terribly “gappy”. I have filled some gaps, but only for months that actually have some measurements. I haven’t done it for months for which no data are available. When I calculated annual totals, I rejected all years that had fewer than 11 months with full (or gap-filled) data. In spite of this (or perhaps due to this) it appears that only five stations can be used in assessing the severity of the 2015-2017 drought: Robben Island, SA Astronomical Observatory, Vrugbaar, Neuweberg and Rustfontein. Out of those stations, only 3 (Vrugbaar, Neuweberg and Rustfontein) are located in the “WCWSS dam region”. The other stations either do not have consistent data covering the last three years, or have huge gaps. From 96 to three… Well, that’s the best I can do at the moment.
Total rainfall from those stations for individual years, and mean for the 2 to 4 year totals are plotted below:
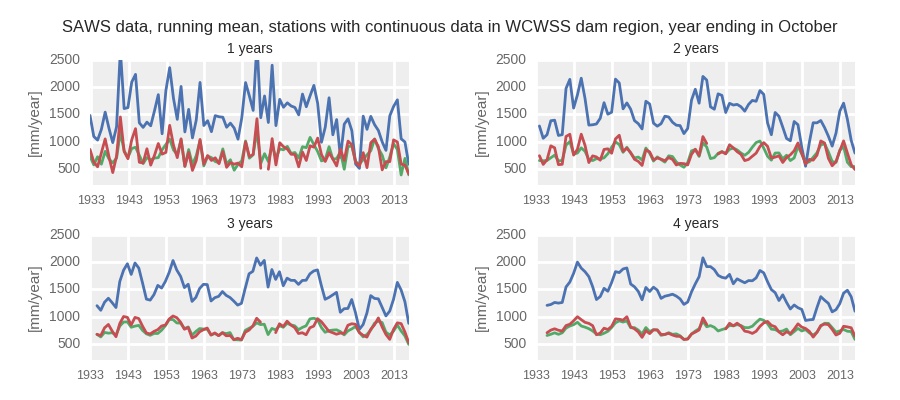
Similarly to the earlier analyses, I plot the mean of the three stations:
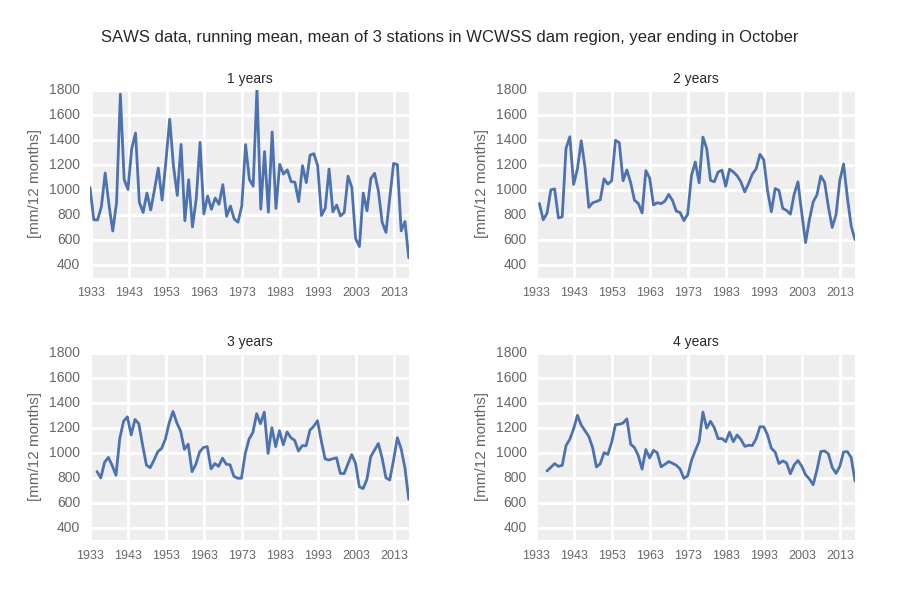
The figures above show that the 2017 was the lowest rainfall year since 1933, as well as that the mean rainfall in the three preceding years, 2015-2017, was unprecedented. However, the 2-year mean as well as the 4-year mean leading to 2017, were not the driest.
We can even go further in time, till 1920, but then we would rely on one station only (Vrugbaar), for which record goes that far. This is how plots for this station look:
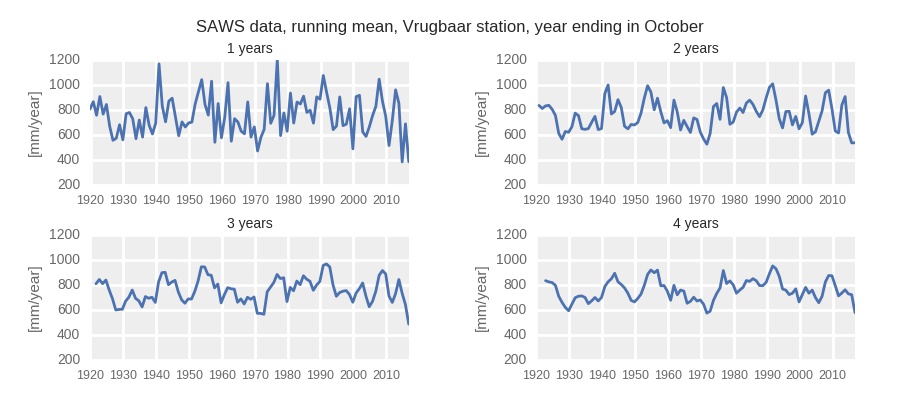
Again, the 2017 rainfall for that station, and importantly the mean of 3-years prior to 2017 were lower than in any period experienced by this station since 1920.
Interestingly, if one looks at the long-term rainfall data for the 2 stations located near the coast, the situation is slightly different:
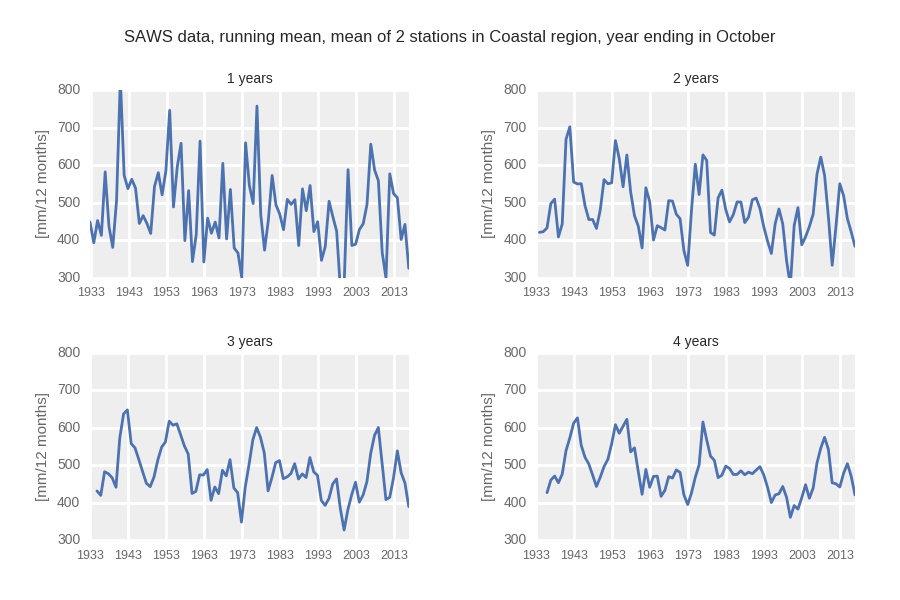
Here, neither 2017 alone, nor in combination with preceeding years were the driest on record.
Coming back to the long-term SAWS data from the WCWSS dams region – in that data, 2017 and the period of 2015-2017 were the driest since 1933. This simply translates into drought return period of once in 84 years. Possibly rarer. But how rare exactly?
It is possible to assess the return period based on a statistical distribution of rainfall values rather than on the actual data. The rationale for this is that observational data (i.e. rainfall) is in reality only a relatively short-term sample of all possible rainfall events that can occur at a location under a given climate. The fitted distribution function, rather than the sample itself, describes that climate. Having that distribution function allows for, firstly, extrapolation beyond the length of observational data series, and secondly for determination of uncertainty of the estimate of the return period.
This analysis is illustrated in the figures below. The distribution function that fits the best is the Gamma distribution (shown in the left-hand-side panel). And estimates of return interval based on that distribution fit those based on data (i.e. on the sample) very well. This is illustrated by the agreement of the solid line and the data-based dots in the right-hand-side panel.
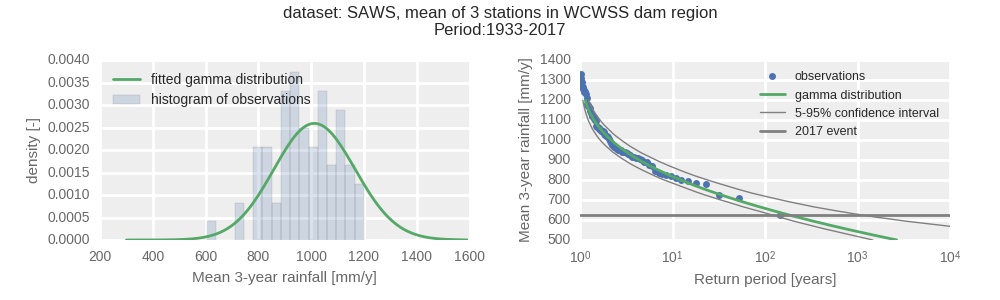
NB. The plot in the right-hand-side panel is the so-called Gumbel plot. In that plot, observed data (markers) are plotted in a way that takes into account the uncertainty of observations and derived return interval. So the return interval for 2017 does not correspond to what one could simply derive from the data, i.e. 84 years.
The 90% confidence interval plotted in the right-hand-side panel is obtained by bootstrapping. I have used a stationary bootstrapping procedure so that confidence interval takes into account the autocorrelation in data (for there is autocorrelation in annual rainfall totals in the first place, and of course in the 3-year running mean which is used to determine the return interval of the drought.
So what comes out of this analysis? The best estimate of the return interval of the meteorological drought in the region of WCWSS dams is 311 years, with 90% confidence that it actually falls between 105 and 1280 years.
This is pretty rare and actually in the same range as my earlier estimates.
Of course, one may question that result in many ways. Are the stations used representative? Perhaps if we had a different set of observations we would get a different result? Does it make sense to use the average of several stations in the analysis? Perhaps there are errors in data?
I think this dataset is robust. I have taken care in the preparation of the dataset to find continuous, long-term data. Using averages of several stations reduces the chance that data errors affect the result. The drought, as manifested by rainfall in the region of WCWSS dams, is indeed very, very rare, and thus very, very severe.
Importantly, the analyses reveal that the drought was likely much less severe in the coastal plains and in Cape Town itself. A possible reason for that might be a weaker penetration of cold fronts that bring winter rainfall to the region into the higher and distant inland regions.
Before I conclude this story – one more figure to think about:
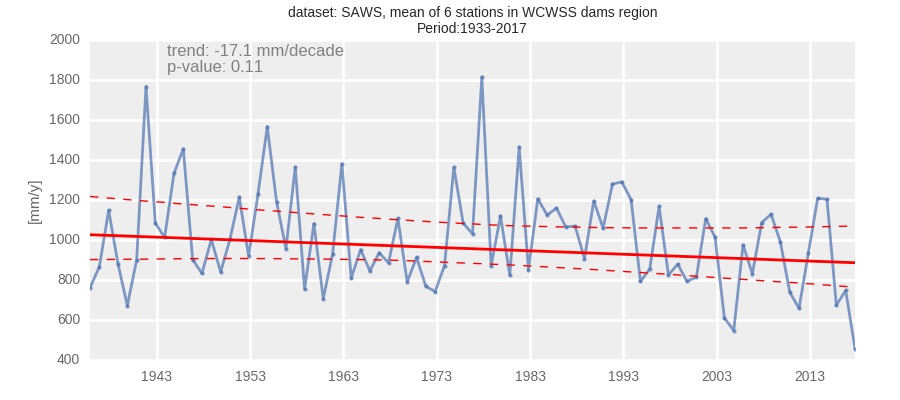
This figure shows a trend in rainfall in the WCWSS region over the last 84 years. That trend is towards lower rainfall and it has a relatively strong magnitude – 17mm/10 years. It is barely statistically significant, though. The important thing is that this trend may be an expression of anthropogenic climate change, and may be affecting the return interval of droughts. Simply, if that trend was not there, a drought of the magnitude experienced in 2017 would be much less likely. Or, to put it in another way, if that trend was not there, then the 2017 drought would likely be much less severe.
I can calculate how does the trend (and thus perhaps the anthropogenic climate change) affect the probability (or return interval) of the drought, but this is a topic for another blog…
In summary – the analyses presented above, based on the best rainfall data available at this time, indicate that the drought, manifested through low rainfall in 2015-2017 was very rare and severe.
Much more severe that could be handled by the WCWSS without any problems.
Acknowledgements are due to SAWS and DWS for data, and Chris Jack and Stefaan Conradie (both CSAG/UCT) for valuable discussions.
Kilian Hagemann
Well done Piotr and CSAG, an oasis in the surrounding desert filled with blame, anger and fear
Glen
Have you considered restricting the trend analysis to just winter wet season rainfall? That is where a strong GW trend would be expected.
For example here is the winter rainfall trend for similar geographical conditions in SW Australia:
https://twitter.com/Gergyl/status/955701595194314752
Piotr Wolski
Firstly, water supply systems, as any man-made things of similar nature, are designed with a certain performance assurance level. For WCWSS that assurance level is 98%. The City of Cape Town buys water from WCWSS, and their agreement specifies level of assurance of 97%. You can read about it here. This source comes up as the first on Google search of “WCWSS supply assurance”. So here you go! The 97% means that the full, unrestricted demand is met only 97% of the time. Or only 29 years out of 30. This does not mean that the system will fail completely during one year out of 30, but if you have conditions that arise as rarely as once in 300 years, the failure is not unexpected.
Secondly, that statement has nothing political about it. It is a statement about an engineered system.
Lastly, no, I wouldn’t consider marketing, because I’m open-minded and look at as many sides of a problem I can possibly fathom, and contribute to the discourse based on my expertise, and only when I have something meaningful to say. Unlike people who promote ideas or products without understanding them fully with the objective to satisfy customer requirements profitably…
Mark Jackson
“Much more severe that could be handled by the WCWSS without any problems.”
You see, aren’t you’re doing it again – mixing up political bias with science. How on earth do you know it was more than could be handled by WCWSS? Where is the proof for that?
Looking ahead, perhaps marketing would be a better career path? 😉
Sarah Chapman
Thank you for this thoughtful and data-rich exploration. This is a wonderful resource at a time of such speculation and uncertainty.
Steve SMith
An somber picture of the current drought. It would be insightful to see what the average water usage for the Western Cape would look like superimposed on the rainfall data over the past 10-15 year period. I would think that it would show up the drought in a far more severe light.