The sooner we know the answer, the sooner we can prepare for summer 2019
By Peter Johnston and Piotr Wolski
15 March 2018
The approaching autumn and winter season in Cape Town is being keenly awaited to see if it will bring sufficient rain to end, or at least alleviate, the drought. If the rains are above average, the city should be able to avoid Day Zero next year. But if they’re below average, it will be very hard to do so.
No seasonal forecasts have sufficient skill to predict the likelihood of an above norma / normal / below normal rainfall season. This makes it difficult to plan for the near future. For example, should water restrictions be made stricter or relaxed?
We have observed that in the past, many of the years that had the lowest overall annual rainfall were the same years that recorded low rainfall during the months before the start of winter. So we wondered if this was a statistically valid predictor for the approaching winter rainfall totals. In other words, we had a suspicion that if there is above average rainfall up to the end of, for example, April, then there could be a better chance that by the end of winter, the rainfall total will also be above average. The opposite could be also be true: if the rainfall until the end of April is below normal, the total rainfall may likely be lower than normal.
This could result from two processes. Firstly, there could be an underlying climate factor that causes lower (or higher) rainfall, and that persists throughout seasons. In this way, the amount of rainfall in the beginning of the rainy season is an indicator of the amount of rainfall the rest of the season receives. This might appear surprising at first sight; as it would mean that the weather in winter is dependent on the weather preceding it. But such dependencies are not unexpected. In fact, we may expect similar persistences to last a year or even longer. That influence might be minimal, but it could still help with predictions.
Secondly, we are looking here at the accumulated rainfall figures. This means that when we are attempting, in April, to predict total amount of rainfall that falls between January and the end of December, the known rainfall till the end of April contributes some proportion of the figure we are trying to predict. But there are still eight months of rainy season left, and so a lot can change. If we were to make our prediction in October, there would be only two months of (relatively low) rainfall left that could change our prediction. So, that prediction would not be very likely to change.
To understand how we know this, we need to explain a few things first.
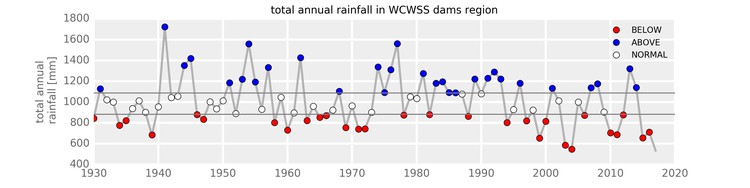
Firstly, we need to understand what we mean by above average, below average and normal rainfall. Above average means the wettest one third of all the years. Below average means the driest one third of the years. Normal is all the years in-between. This is illustrated in the graph below, which shows average rainfall data for three weather stations — Nuweberg, Vrugbar, and Rustfontein — in the Western Cape dam catchment area from 1930 to 2017.
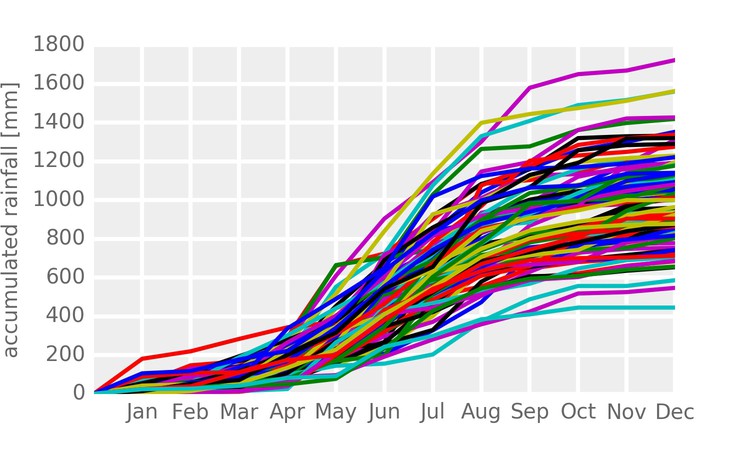
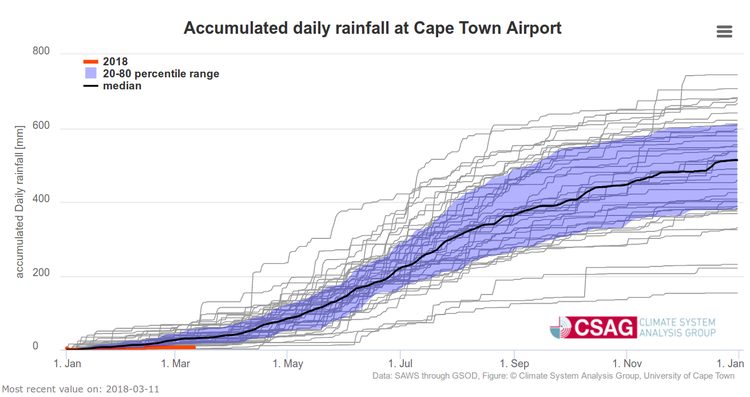
Let’s assess our suspicion that, based on the rainfall total at the beginning of the rainy season, we can tell how much rainfall the entire rainy season will receive. In the figure below each of the lines corresponds to one year in the 1930 to 2017 period, and shows the amount of rainfall as it accumulates during that year. The lines cross each other, and one can easily find years where rainfall total was relatively low in April/May, but relatively high towards the end of the year, and vice versa.
This is better illustrated in the figure below. Here, we divided the January to April total into the three categories defined earlier, and tracked how rainfall progressed in the succeeding months.
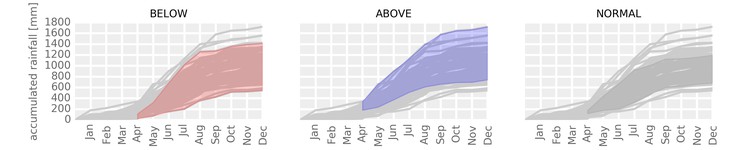
It is clear that whether the season turns out to be wet, dry or average is, to a certain extent, determined by whether it was wet, dry or average in April. From this, we can determine what the probability is of the whole year ending up wet, when it was wet in April. This we do by simply counting how many of the years classified as above average in April, turned out to be above average in December.
There are 88 years, 28 of which (one third) are classified as above average (wet) in April. If, for example, 17 of these turned out to be above average in December, there would be a 60% probability (17/28×100) that a year that is wet until April will be wet until December. Likewise, if in May, 20 of the 28 below average (dry) years end up still being below average in December, then the probability of a dry year in May still being dry in December is 71% (20/28×100).
So finally, we can present our probabilistic forecast. We calculated probabilities for forecasts issued at the end of each month, but considered only the total till the end of October rather than till the end of December. This is because the rain until the end of October is the main determinant of the end-of-season storage in the Western Cape Water Supply System (WCWSS) dams, and therefore most of the water that will be available to Cape Town.
We can make a couple of observations from the figure below.
Firstly, as we progress through the year, the probabilities of staying in the same regime (wet, dry or normal) increase, while probabilities of changing regime reduce. If we make a forecast for the season in August, there aren’t many months left to change the amount of rain in that season. But if we consider the situation in February, there is still plenty of time for the season to develop differently.
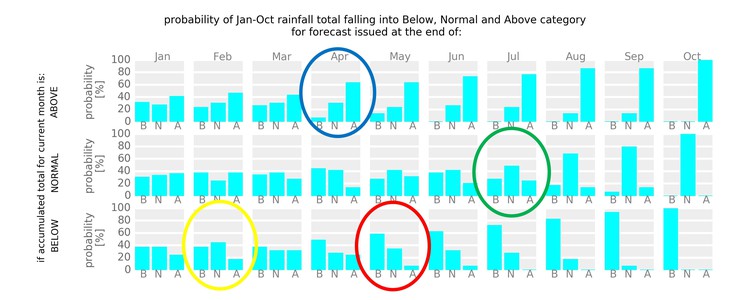
Secondly, we can see that the probabilities change slowly, but at a certain point, one of the three options starts clearly to dominate. In other words, at a certain time, rainfall seems to be “locked” into a particular regime.
For example, from the graphs, we are locked into a wet year when cumulative rainfall recorded by the end of April is above average. At the blue circle, the probability is 5% for below normal rainfall for the whole season, 30% for normal and 65% for above normal. However, we are locked into a normal year only in July/August (green circle; 25% for below normal, 50% for normal and 25% for above normal). Likewise, we can say with some confidence that the year is going to be dry, at the end of May (red circle; 60% for below normal, 35% for normal, and 5% for above normal). These remain probabilities, but they are a useful guide for how we prepare for summer 2019.
So where are we now? From the graph below, we can see that 2018 (January and February) is well below normal for the year so far, but from the probability figure above, at the end of February, there are equal chances of below normal, and normal rain by the end of the year (Yellow circle). So it’s too soon to say how the year’s rainfall will turn out.
In a nutshell, this is what we have found:
- At the end of April, if we are above normal, it’s likely we’ll have above normal rainfall by year end.
- At the end of May, if we are below normal, it’s likely we’ll have below normal rainfall by year end.
- At the end of July, if we are in the normal range, it’s likely we’ll have normal rainfall by year end.
Let’s keep watching the accumulated rainfall after each month. It could soon provide us with some answers about the likely seasonal total, and help government, farms, and Western Cape urban residents make decisions about what to do for 2019.
Published originally on
GroundUp
.
© 2018 GroundUp. 
This article is licensed under a Creative Commons Attribution-NoDerivatives 4.0 International License.
You may republish this article, so long as you credit the authors and GroundUp, and do not change the text. Please include a link back to the original article.