9-point summary:
- The Cape Town water crisis was the consequence of a severe 3-year drought affecting most of the winter-rainfall zone (WRZ) of South Africa and especially the Boland Mountain Catchment (BMC) that supplies water to Cape Town’s supply dams (see Piotr’s detailed analyses on drought severity and drivers)
- The Western Cape Province has 3 main rainfall seasonality regions: winter (West Coast), all-year (South Coast and little Karoo) and late summer (February-April; Great Karoo) .
- Each of these extends into at least 1 adjacent province: the Free State and Eastern and Northern Cape
- Because these regions receive rainfall at different times and from different types of rainfall systems, drought in these regions occur largely independently of each other and need to considered separately
- For example, although SAWS and Piotr both found that 2015 was the driest year before 2017 over the BMC in records back to the 1920s or 1930s, average rainfall over the Western Cape province for that year was about average, because the all-year rainfall region was very wet (source: independent research by fellow PhD student Sabina Abba Omar and a quick check via CRU4 via KNMI Climate Explorer)
- In 2017 severe drought conditions co-occurred in all 3 rainfall seasonality regions of the province
- The WRZ has had good rains so far in 2018 (although July is shaping up to be drier than usual), so that the continuous drought of September 2014-September 2017 appears to have been broken
- However, dry conditions persist along the South Coast of the Western and Eastern Cape
- Some of the most severe drought conditions in the WRZ were experienced in the Northern Cape and for the all-year rainfall region, the most intense drought conditions have occurred in the Eastern Cape
Details:
The severe 3-year “Day Zero” drought that threatened Cape Town’s water supply is often referred to as the “Western Cape drought” or the “Cape Town drought“. These terms have even been used regularly in scientific work on the topic (e.g.: this interesting and important new study on the role of climate change in the drought; and this CSIR report on the Knysna fires of 2017). In some cases people have even referred to “South Africa’s drought” (as in this otherwise pretty good article on the drought conditions that prevailed across much of southern Africa—particularly the summer-rainfall region—between September 2014 and March 2016). This recent international publication refers to “South Africa” as having experienced a 3-year drought. Much confusion/misinformation persists, with many suggesting a link between the drought and El Niño, even though this link is only valid for summer rainfall and in fact El Niño events have been found by UCT Oceanography researchers to correlate positively with rainfall over the south-western Cape (see this earlier blog for more detail). Describing the drought as occurring in Cape Town, the Western Cape or South Africa strikes me as strange, because the references to political regions appear to suggest that clouds—and consequently rains—respect political boundaries. Other than in cases where political boundaries correspond to prominent topographical or other geographical features, this notion is clearly rather obscure. Scientists presumably use such terms for the sake of convenience, referring to well-known locations people are more likely to be familiar with, which correspond roughly to drought domains. However, this post (source: Anna Steynor posted it on CSAG slack), in addition to many other errors (e.g., Humansdorp is not and has never been in the Western Cape), seems to shows that many people really do believe that that provincial location determines drought severity. Inadvertently, therefore, if we are not careful about how we describe and refer to the areas we consider for a given assessment, we could contribute to confusion and misconceptions. It is true that Helen Zille and her government have done much to try to “claim the drought” and thus support this narrative of a “Western Cape drought”. The reality, however, is not quite so simple:
While most provinces in South Africa fall entirely in the summer rainfall zone, there are at least three distinct rainfall seasonality domains in the Western Cape. This map illustrates the point well. This one shows the strength of the seasonality, roughly speaking. Along the west coast and the north-south arm of the Cape Fold Belt in the adjacent interior lies the winter rainfall zone (WRZ). Here most rainfall is observed between April and September. This does not mean that all of the WRZ experiences dry summers, just that winters bring most of the rains; in some of the very wet mountains of the Kogelberg and Boland average summer (November-March) rainfall exceeds that in Johannesburg (e.g. at Dwarsberg in Jonkershoek, the wettest reporting station in South Africa, November-March rains average around 560mm, in Johannesburg the corresponding total is around 530mm). Along the South Coast east of L’Agulhas, the Cape Fold Belt from around Riviersonderend and in the Little Karoo, rainfall is relatively evenly distributed through the seasons, with slight peaks in the shoulder seasons (April and September-November). In the eastern interior of the province, including the Great Karoo, most of the rain tends to fall in late summer and autumn (February-April). Each of these rainfall regions also extends into at least one other province: the WRZ stretches along the west coast of the Northern Cape, the all-year rainfall region extends into the Eastern Cape and encompasses Port Elizabeth and surrounds and the Great Karoo extends into the Northern and Eastern Capes and the far south-western Free State. The systems brining rainfall to these three regions are all different. The WRZ receives rainfall mainly from cold fronts, the South Coast and Little Karoo from ridging highs and cut-off lows and the Great Karoo from tropical-temperate troughs, thunderstorms and cut-off lows.
Because rainfall tends to fall during different times of the year in different areas and due to different weather systems, these areas generally experience drought due to different causes and at different times of the year. The effects of drought are also felt at different times; e.g. Cape Town is most susceptible to water shortages in autumn before the winter rains come, whereas in the Great Karoo the risk tends to be greatest in early summer. So really, droughts in these different regions are separate droughts. In 2015, for example, while the WRZ of the Western Cape was very dry—and, according to SAWS, the Boland Mountain Catchment area (BMC), where the Cape Town supply dams are located, recorded its driest year (at that stage; 2017 would break that record only 2 years later) since at least 1921—most of the all-year rainfall South Coast was wet or even very wet. To illustrate this, and the general development of the drought, I will use drought severity assessment images produced by the Agricultural Research Council and published in their monthly Umlindi Newsletter.
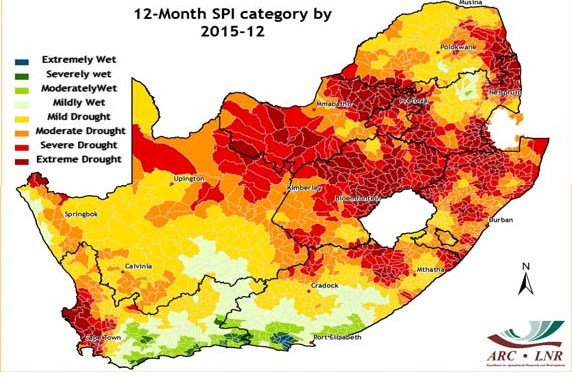
Annual drought severity map from ARC for 2015.
A closer inspection reveals that below average rainfall in the south-western Cape (including BMC) began in spring of 2014. After a very wet late winter rainfall season in 2013, August-October 2014 was much drier:
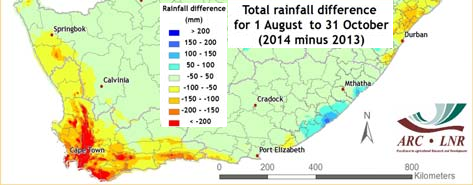
I would suggest therefore that the Day Zero drought around Cape Town and in the BMC particularly, started between August and October 2014 sometime, depending on where precisely. While the precise starting time of the drought may seem relatively unimportant, especially since only the very tail-end of the 2014 rainy season was affected, in assessing the responses of “decision makers” and thinking about future resilience, the risks posed by an early end to the winter season may be worth taking into account.
As already indicated, a dry 2015 exacerbated the situation; 2016 was also dry, but not nearly as bad as 2015. Parts of the South Coast were now also experiencing drought, however, and the situation around Port Elizabeth (also in the all-year rainfall region) was particularly severe:
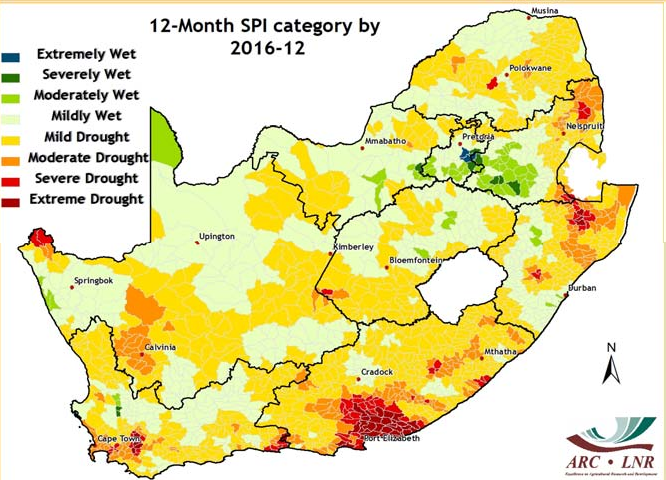
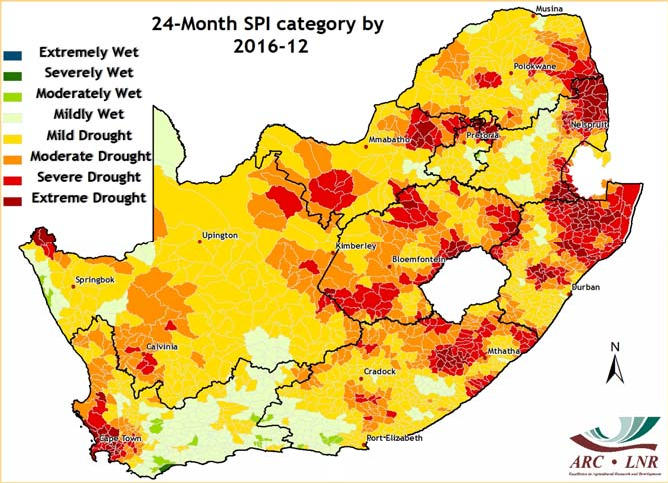
At the 2-year timescale the drought was starting to look serious for much of the WRZ (and many other parts of South Africa):
But much worse was still to come; autumn and winter of 2017 were both much drier than usual and according to SAWS, over the BMC, the full-year 2017 was the driest in records back to 1921. Almost the entire WRZ experienced severe rainfall shortfalls, some of the worst of which occurred in the Namaqualand of the Northern Cape. In 2017, parts of the South Coast, Little and Great Karoo also experienced severe drought:

At the hydrologically (and hence also for dams) important 3-year timescale, the WRZ drought intensity peaked in August/September 2017:
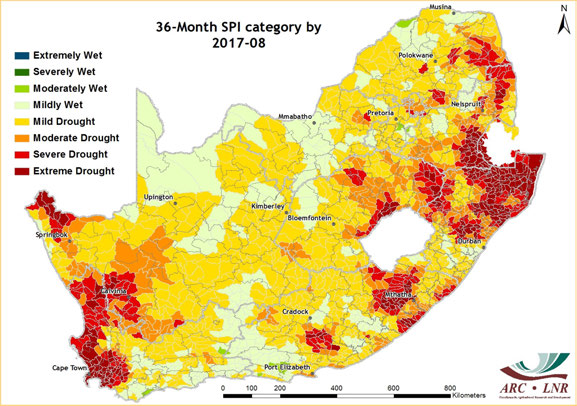
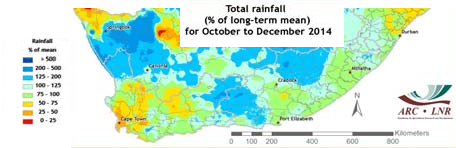
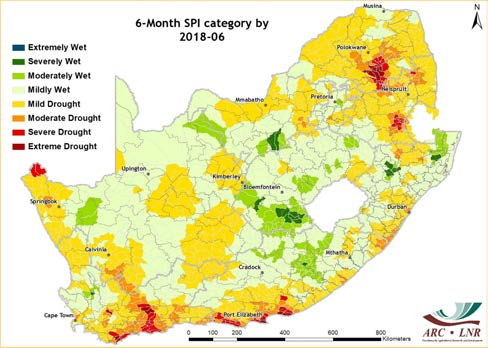
Thereafter, rainfall in the WRZ has generally been near average (yellow or very light green in the figure below), the BMC slightly above average, although drought conditions continue to intensify in large parts of the South Coast region:
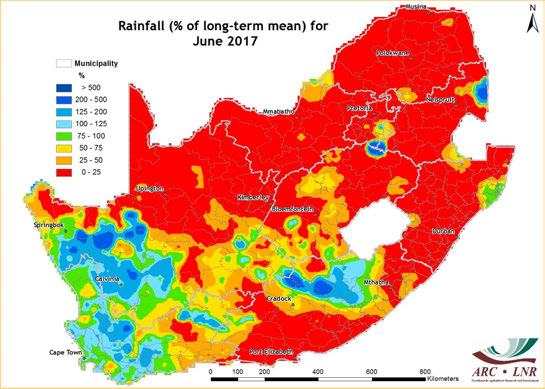
The annual maps hide the fact that rainfall shortfalls occurred during different seasons or months in different regions. For example, June 2017 was generally wet in the WRZ (remember the “big storm”?) while much of the all-year rainfall region was exceptionally dry (Knysna fires), especially in the Eastern Cape.
It is clear, then, that a single multi-year drought cannot affect the whole Western Cape simultaneously and is unlikely to be confined to the province alone. Additionally, claiming that, for example, Knysna has experienced drought since 2015, is unfounded. Drought in the WRZ started sometime soon after August 2014 and intensified until about September 2017. Drought in the all-year rainfall region started towards the end of 2016 and is still intensifying in many parts, while large rainfall shortfalls in the Great Karoo interior occurred mainly in 2017.