
During a conversation last week, a fellow CSAG-er casually mentioned that the probability of precipitation depended on the day of the week. I found this to be puzzling – after all, what does the weather know of the days of the week?
A search of the literature uncovered that this theory is plausible, and that the variability of rainfall occurrence with the (human-introduced concept of) day of the week is human-induced. Numerous studies have linked this phenomenon to pollution, which is in turn influenced by the concept of a “working week”. Roughly speaking, it is suggested that pollution-derived aerosols in the atmosphere change the microphysics of the cloud, not unlike the concept of cloud seeding, thereby increasing the chance of rainfall.
While the literature seemed conclusive regarding the fact the pollution-derived aerosols can affect the weekly cycle of rainfall, it was less so on the direction of the change. A study of near-coastal North West Atlantic ocean areas of the US found that they “receive significantly more precipitation at weekends than on weekdays” [Cerveny and Balling, 1998], due to the build-up of pollutants during the regular working week. However, a later study by Rosenfeld [2000] found “plumes of reduced cloud particle size and suppressed precipitation originating from major urban areas and from industrial facilities such as power plants.[…] both cloud droplet coalescence and ice precipitation formation are inhibited in polluted clouds”. So which is it, and does it happen in South Africa?
Armed with precipitation data from 4000 weather station in Southern Africa, I set out to test this theory. For each station, I tallied the day of the week on which rainfall (defined as precipitation > 0.2 mm) occurred over the time period 1970-2012. At first glance, the distribution of rainfall occurrence by day of week appeared to be uniform (Figure 1).
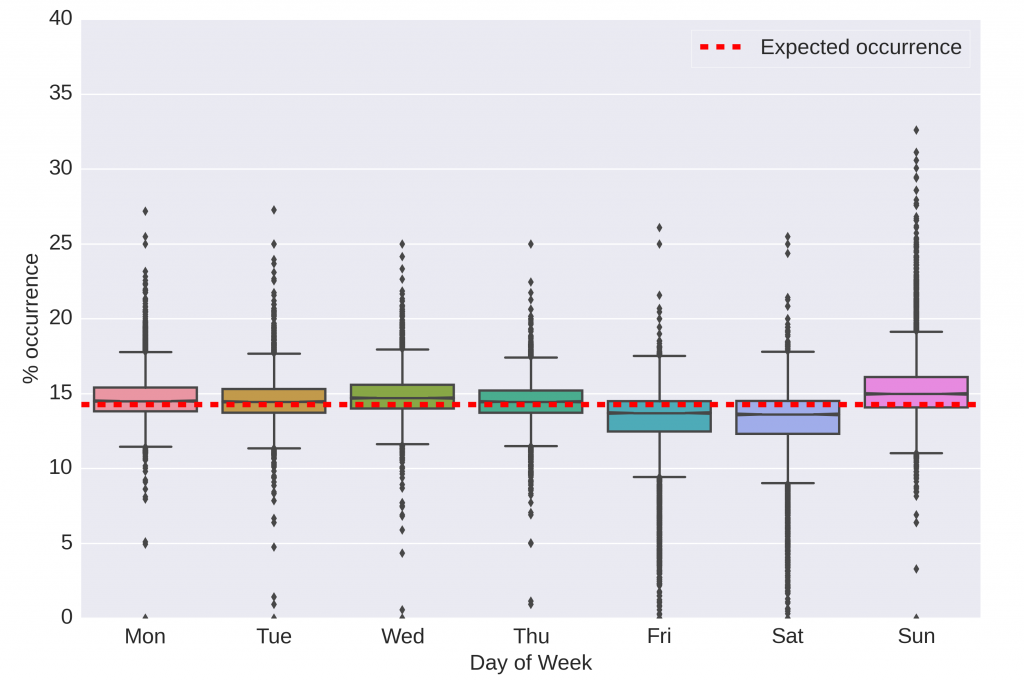
Figure 1: Rainfall occurrence by day of week in Southern Africa (1970-2012).
Myth busted… or so it seemed. Undeterred, I decided to look at the variance in day of week occurrence for each station. This yielded an unexpected result: those stations with high variance all followed the same trend, with a reduced occurrence of rainfall on Friday and Saturday, followed by an increase on Sunday (Figure 2).
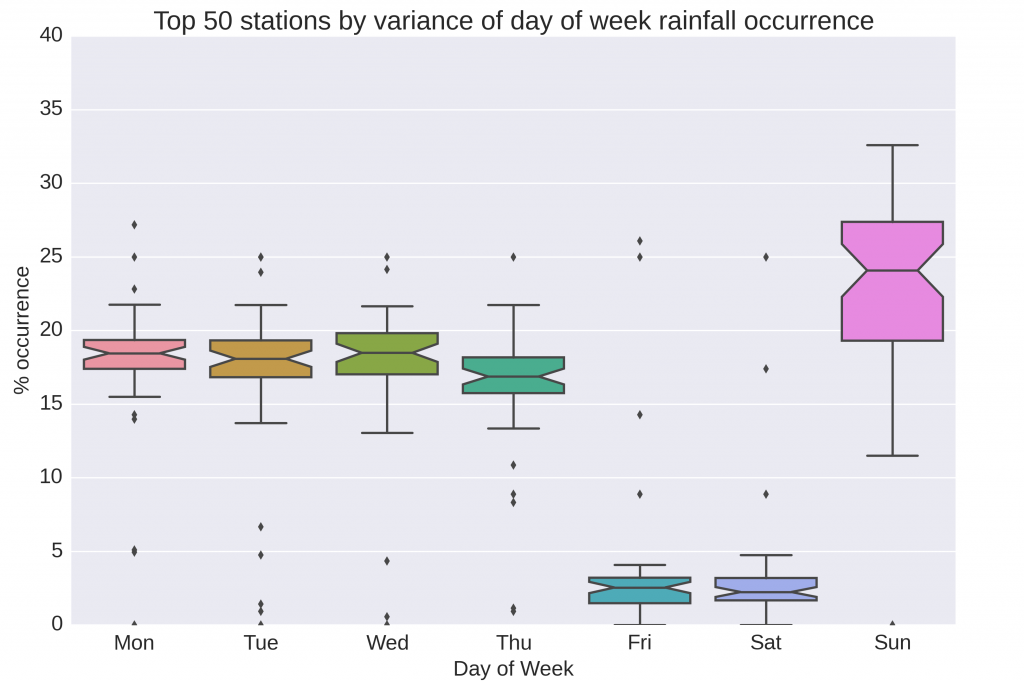
Figure 2: Top 50 stations by variance of day of week rainfall occurrence.
While it should not be unexpected that some stations would have a higher variance than others, the fact they all trend in the same direction is surprising. If the errors in measurement were normally distributed, we would expect these to be distributed amongst different days of the week, as well as an equal number of higher and lower rainfall occurrences amongst stations with high variance. A further piece of the puzzle was the fact that the distribution of variances was monotonic (rather than bimodal), suggesting a smooth transition from Figure 2 to Figure 1, and not simply a batch of bad station data.
So what do the stations with higher variance have in common? Given the original hypothesis of pollution-influenced cloud dynamics, I looked at the mean total CO2 emissions from 1970-2008 [EC-JRC/PBL. EDGAR v4.2] (Figure 3). Every station with a high variance in day of week occurrence was located near major population centres and other hotspots of CO2 emissions, with the only anomaly being the CO2 patch over Mozambique, due to a lack of station coverage. In contrast, those stations in the lower emission regions, such as the Northern Cape and Namibia, were closer to uniform distributions of rainfall occurrence by day of week. As these stations make up a significant part of the observation record, it should not be surprising that the changes in rainfall occurrence were not immediately obvious.
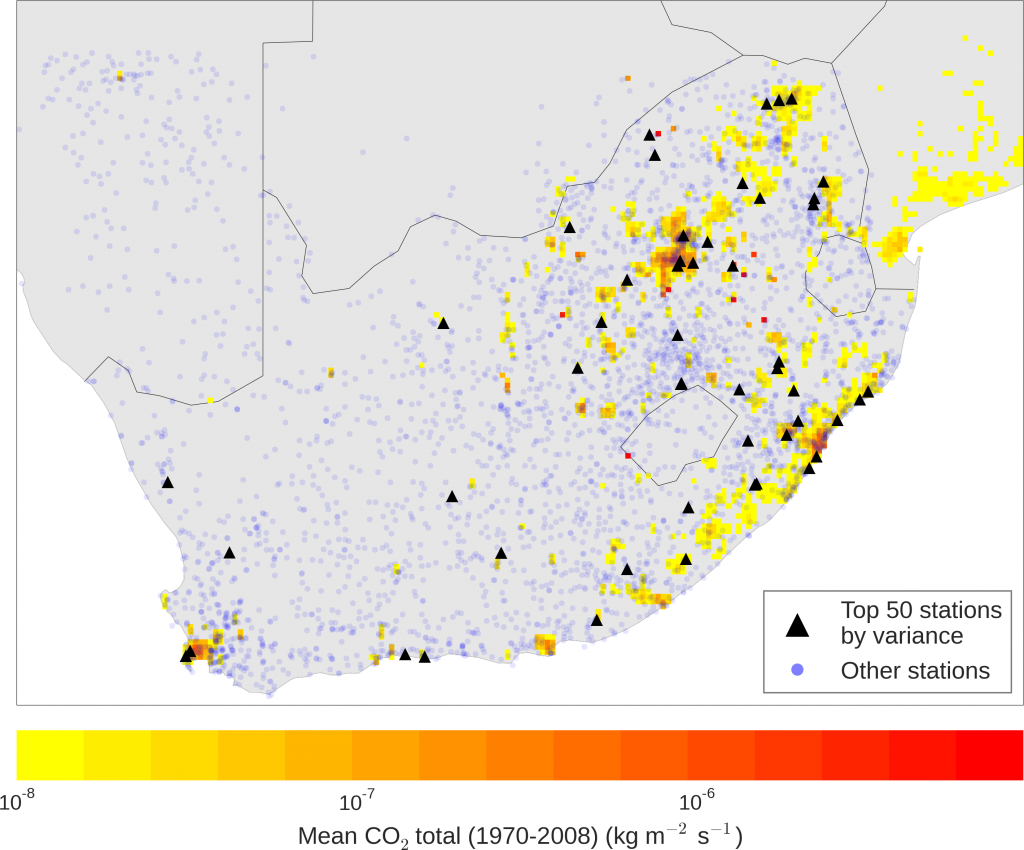
Figure 3: Station locations versus EDGAR CO2 totals.
Do you have plans this Sunday? If so, bring an umbrella, just in case.
References
Cerveny, Randall S, and Robert C Balling. 1998. “Weekly Cycles of Air Pollutants, Precipitation and Tropical Cyclones in the Coastal NW Atlantic Region.” Nature 394 (6693): 561–63.
European Commission, Joint Research Centre (JRC)/Netherlands Environmental Assessment Agency (PBL). 2009. “Emission Database for Global Atmospheric Research (EDGAR), Release Version 4.2.”
Rosenfeld, Daniel. 2000. “Suppression of Rain and Snow by Urban and Industrial Air Pollution.” Science 287 (5459). American Association for the Advancement of Science: 1793–96.
Alex Shabala
Despite the fact that it rained this past Sunday, I have a feeling Chris might be right.
I re-ran the analysis with TAMSAT (1980-2014), and the variance was minimal (<6%). Despite the fact that it is satellite derived (and all the problems that come with that), I would expect more of a signal if this was a real-world phenomenon.
The hypothesis in the office is that more remote stations (e.g. Northern Cape) were the first to go automated, and urban locations persisted with manual stations for longer. Sadly, SAWS doesn’t seem to have any station metadata available, so I can’t separate the types of measurements.
Mark Tadross
This was really interesting to read and I was scratching my head about the Friday question. If SA was predominantly Islamic I might have been convinced ! I think Chris might be on to something, but I would have expected that those stations where observers are away for the weekend would more likely be in rural areas, not coincident with CO2 emissions. Maybe my understanding of what would draw observers away needs re-examining 🙂
Chris Jack
Really interesting analysis… but I’m not convinced! Its too neat and the Friday behavior is odd. The first thing that jumps to mind is that we know there are often problems with manual observing stations on weekends. Manual observations are taken at 8AM so rainfall measured at 8AM on saturday is recorded as Friday’s rainfall. But for some stations there is no-one manning the stations on the weekends so you get very low rainfall measured on the weekend and a lot of rainfall on “Sunday” (aka, Monday morning) which is what your analysis shows. I suspect you are hitting these stations in the analysis. The co-location with urban centers is likely related in some way or spurious.
It’s also really hard to think of a physical mechanism for frontal rainfall links to pollution as under frontal conditions the polluted air is whipped away so quickly it wouldn’t have a chance to play a role.
Would be really nice to see the analysis repeated with pure satellite data like TRMM or a satellite/station merging where stations data is only used for monthly climatological bias correction (ARC, TARCAT I think)
Perhaps what you have hit on is a very useful quality control metric for us to implement.
Bruce
As an example of inquiry driven analysis, this is really great! Warrants unpacking into a short paper! The Friday question is really interesting …. is it lag (how so?) or accumulation of an effect (and why 5 days) or feedbacks, or …
(Now can you also tell me: is the nature of cold fronts are changing; why it rains more on the lee of table mountain; and is to co-behaviour of ENSO, AAO, and MJO the determinant of seasonal variability in TTTs?)