Much has been argued about the causes of the 2017 Cape Town’s water crisis. Is it the drought? Is it climate change? Is it population growth? Is it lack of foresight by the national government or the local government? Is it the rich? Is it the poor? Is it farmers? Or industry? Or invasive trees?
The process of analysing causes is understandable and necessary. We want to know. We need to know. We need to understand because only then we can learn properly from the experience in order to avoid similar crises in the future.
We have heard and will continue to hear various perspectives on this. They are and will be coming from scientists, civic activists, the government, various interest groups, experts and non-experts alike. Importantly, opinions might be based purely on perceptions, or they might be based on data and facts.
Here I would like to contribute to this discussion with some data-based analyses. I will attempt to answer a question about the last three years (2015-2017):
To what extent has unusual climate and unusual water use in this period affected dam levels and the amount of water available to Cape Town?
To answer this question I have developed a simplified water balance calculation — a hydrological model — for the Big Six reservoirs and their catchments. Let me explain the idea.
Consider a water supply dam or a reservoir. There are two sources of water there: direct rainfall, i.e. rainfall that falls directly on the surface of the reservoir, and rivers and streams feeding that reservoir. These are inputs or inflows. There are three ways that water can leave that reservoir, namely: evaporation back to the atmosphere, spill over the dam wall which might happen if the reservoir is full and water is still flowing in, and a release of water through a canal or a pipeline to feed the water supply system. These are outflows. Water accumulates in a reservoir if inflows are larger than outflows. Storage is depleted if inflows are smaller than outflows.
Of course, I simplify this. The reality is a bit more complicated. Water in a reservoir interacts with groundwater. That groundwater might flow in, or flow out of a reservoir. Also, the releases of water from a reservoir might be controlled by factors different than water demand, for example, the need to maintain biological life in the downstream river. Or not all water that is released might go to the water supply system. But let’s brush these things aside for a moment, and deal with a simple system as outlined above.
The water balance of a reservoir will thus be:
change in storage=inflows-outflows
or more comprehensively:
change in storage=direct rainfall + river inflow – offtake for use – spillover – evaporation loss
I have data on rainfall, evaporation and water use. Spillover is easy to calculate, as it occurs when a reservoir is full. The only element that is missing in order to calculate changing reservoir storage is thus river inflow. Some river flow data are available, but I am much more interested in calculating this variable rather than using these data. This is because if I calculate river flow from rainfall data I can then assess the influence of rainfall anomaly on reservoir storage explicitly, which is what is of interested here.
To calculate river inflow from rainfall, I again calculate a water balance, but this time of a river catchment, i.e. the area from which the river collects water. There are differences between catchment and reservoir water balances, of course. For example, there are no inflows other than rainfall, water is stored within the catchment in the form of soil moisture, outflows are dependent on both rainfall and soil moisture status, evaporation is dependent on moisture status, and there is some delay between rainfall and water flowing out of the catchment. In principle, however, still, a change in storage is equal to the ins less the outs. Importantly, catchment water balance calculations require some assumptions, some parameters that we don’t know a priori, i.e. before we actually perform the calculations. These need to be adjusted so that the calculations yield results that agree with observations.
In the case of the WCWSS system, I have put the two water balances together, and based on rainfall, evaporation and water use data, I calculated reservoir storage. I then compared the calculated and observed storage, and adjusted the parameters so that my water balance model simulated the observed storage well. An important note here: in that water balance calculations I bundled all the Big Six dams together, and bundled all their catchments together too.
These are the input data I used:
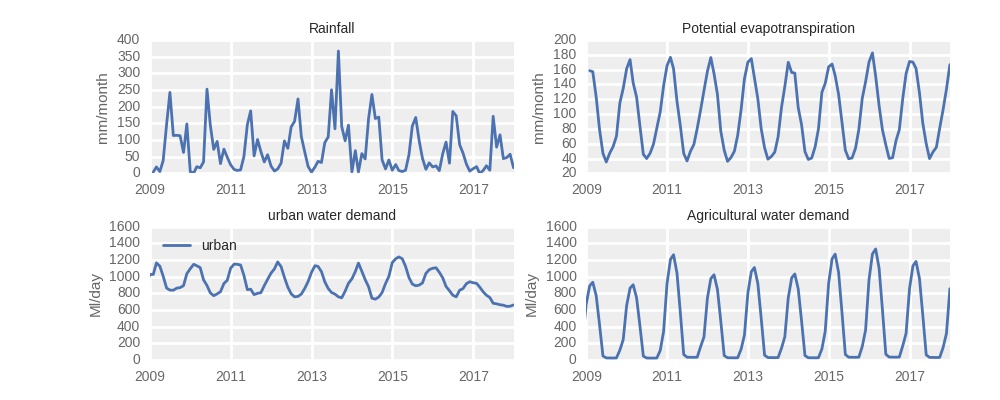
In those calculations, rainfall is taken as an average of values from five sites, which are located near each of the Big Six dams (there are two Steenbras dams, but I use only one rain gauge to represent rainfall over them, so there are five and not six rain gauges). Potential evaporation is calculated from meteorological variables measured at 35 Agricultural Research Council meteorological stations across the region. Water use by agriculture, Cape Town and the smaller municipalities are represented by data from the City of Cape Town.
And this is how the results of the water balance calculation (a water balance model) compare with observed reservoir storage:
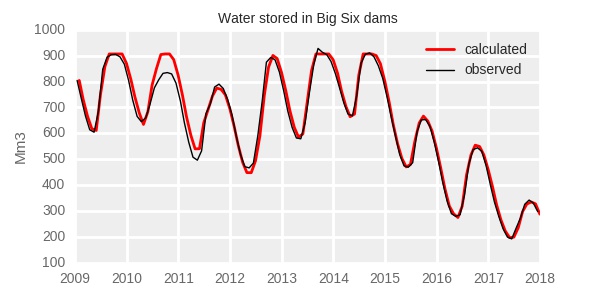
Note that during the process of adjusting the model parameters I used only the 2009-2016 data, leaving 2017 out. Reservoir storage in 2017 was calculated AFTERWARDS, as a way to verify the accuracy of my calculations. It looks like the model works well indeed! There is some difference in 2010, but that is most likely a result of an error in the data rather than a deficiency of the calculation procedure.
Now, I can use the model to answer the question posed earlier: what is the relative role of climate versus water use in lower dam levels in 2015-2017. However, I rephrase this question slightly differently as four “what if” questions.
(1) What if rainfall was average?
(2) What if evaporation in that period was average?
(3) What if municipal water use in that period was average?
(4) What if agricultural water use was average?
To answer these questions I do the water balance calculations with either rainfall or evaporation or water use in 2015-2017 set at values representing recent average. The average values were calculated for the 9-year period of 2006-2014. This is a relatively short period, but considering that we are looking at an evolving, changing system, taking longer averages might be somewhat misleading. These average values are illustrated below, together with the original data:
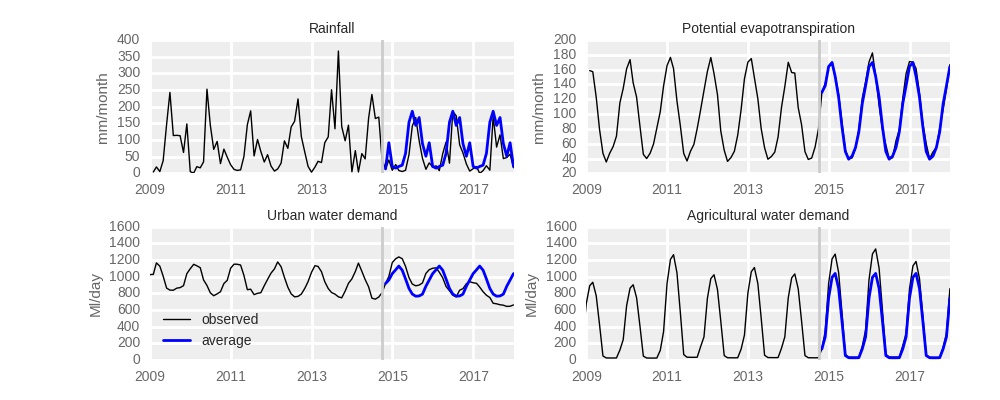
The graphs show clearly that in the 2015-2017, rainfall was considerably lower, evaporation was not different, and agricultural use was higher than the recent average. Urban use was higher than the recent average in 2015 and 2016, but lower in 2017.
These average values are included in the water balance calculations one at a time. This means that with average rainfall, actual observed values of the three remaining variables (evaporation, urban and agricultural use) are used. This creates four scenarios describing the “what if” situations. The results are as follows:
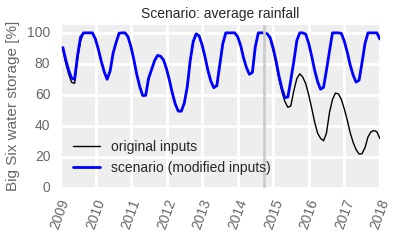
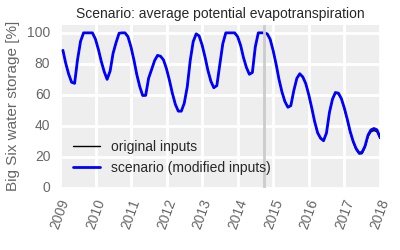
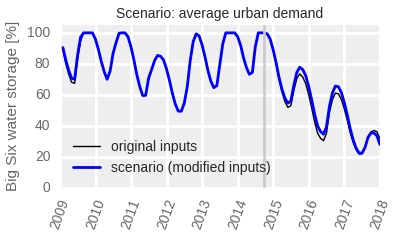
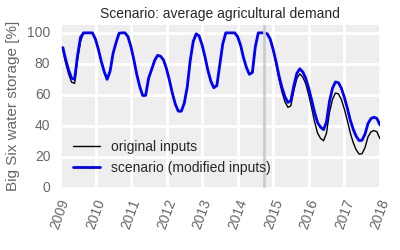
It is clear from the above figures that the main driver of the dropping dam storage was lower rainfall. Unusual evaporation played a very limited role. Increased water use (compared to that in the preceding years), both municipal and agricultural, also contributed relatively little to the reduction in the available water.
If rainfall was average, we would have had full dams at the end of the rainy season every year from 2015 to 2017. If urban water use was average, dams would have only been five percentage points higher at the end of 2016 rains than they actually were. The lower urban demand in 2017 compensated for that deficiency, however, and at the end of 2017 there was no longer a difference between dam levels under the actual, and under the hypothetical average urban use. The higher than normal agricultural demand, however, reduced the reservoir storage at the end of 2017 by about 8.5 percentage points compared to average demand.
So what do these results tell us about the “day zero” crisis? We have to consider the above results in the context of three slightly different concepts, namely drought, water shortage and water crisis.
The first is a meteorological event manifesting through lower rainfall and higher temperatures and evaporation. The second is a hydrological event (we may call it a hydrological drought, actually). The last is a socio-economic event.
A meteorological drought may, but does not have to result in a water shortage. As the analysis presented above shows, water shortage was predominantly a result of drought or actually lower rainfall; higher evaporation played a very limited role. That water shortage occurred because Cape Town had no water resources that would be resilient to drought, particularly to a multi-year one. The water shortage did not occur because Cape Town was using more water than previously. It did not occur because agriculture was using more water for irrigation than previously. It occurred because rainfall was low. Increased water demand only exacerbated the problem.
Water shortage may, but does not have to result in a crisis. Simply, water shortage may be merely a nuisance of prolonged, but relatively mild water restrictions and it does not have to grow into a fully fledged crisis that threatens the existence of a city and has dramatic strong social and economic consequences. Perhaps the “day zero” threat could have been avoided if water allocations were slightly lower, or water restrictions were implemented earlier.
Had agricultural demand been curtailed by approximately 25% already in the 2015/2016 and 2016/2017 growing seasons, dam levels in 2017 would be 8.5 percent points higher than they actually were. Similar reasoning applies to the urban use. But we know this only now, with the benefit of a hindsight. It’s easy to have opinions about past events while having such a benefit. It is more difficult to take decisions there and then without it.
To assess the role of water management decisions that were taken in the last three years requires a different analysis than the one done here, however. I am busy with such analyses, so watch this space.
For the time being, let me reiterate: the water shortage in 2015-2017 occurred mainly because rainfall was low.