There is no need to remind that Cape Town’s water supply situation is dire. We have level 4 water restrictions in place, water storage levels are extremely low and alternative short-term and long-term water sources are actively being sought by the city’s government – solutions such as funding a set of temporary desalination plants, and restrategizing Cape Town’s water supply system to include under-utilized groundwater.
By now, the drought “officially” lasts for over two years (in fact, 2015-2017 was the driest three-year period on record that started in the early 20th century). In the last two years, we have all been bombarded with messages with increasing level of gloom and urgency: from “dam levels at 40%” to “dam levels at 15%” to “dam levels at 11.4%”, “only 100 days of water left”, “can you live on less than 100 liters per day?”, “each person MUST use less than 100 liters per day”.
In the meantime, rainy season unfolds, and as cold front after cold front deliver winter’s rainfall to the parched city and its dams, we might feel some sense of relief. We might think: “Now, that it rains, what’s the problem with water? I can go back to ‘normal’!”. But should we? The City of Cape Town warns: “It will take at least three consecutive winters of above-average rainfall to make a real difference to the availability of surface water”. It’s a statement that is difficult to appreciate when one’s windows are pounded by (relatively) heavy rains.
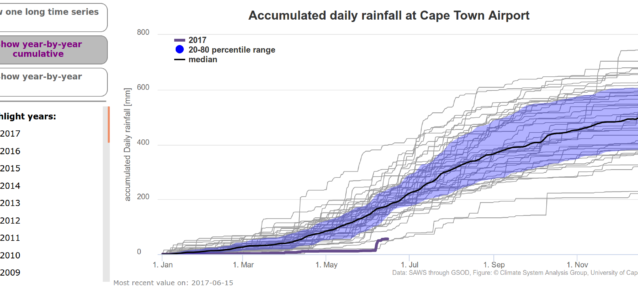
To help us all understand our predicament, we at CSAG, have developed a “rainfall monitor” – an online graph that presents this season’s rainfall in the context of long-term conditions. Based on the most recent rainfall data (subject to availability, of course), one can see how the season’s total compares to that recorded in years since 1977. It’s interactive – one can choose to view rainfall time series in different ways, and relate current conditions to years one remembers. This graph is a first part of a more comprehensive system we are building which will allow for visualizing not just rainfall, but also water levels and river discharges, and not just current, but also forecast values.
So go ahead, explore this tidbit in the sea of (climate) information. Learn about your climate and its variability. Think about its implications to your every-day life…
Piotr Wolski
Thanks for your comments, Stefaan. Yes, we’re aware of the disparity between the “official” SAWS records and GSOD data, and are in the process of querying SAWS about it. We have checked a number of different datasets that could be used in the context of near-real time monitoring, without violating anyone’s rights, and ensuring a relatively constant stream of near-real time data. Out of options we have available, GSOD is the best. Hopefully, one day, we will be able to use long-term records of SAWS and tap to their daily stream of measurements… In the meantime, we have what we have. GSOD might indeed be missing some events or under-report them, but we think it does so consistently across years. So the data you see in the “rainfall monitor” reflect realistic (although, admittedly, not precise) conditions of the season.
Willem Stefaan Conradie
In terms of the rainfall data for this year, I’ve checked SAWS’s 10-daily rainfall figures for the airport and they have 51mm for 10June and 24 for 20June, which would give 75mm for the month, yet for the year-to-date the figure given here is 70mm, including 13mm from before June.
Willem Stefaan Conradie
@Jasper
Thanks a lot for the link, very interesting!
Willem Stefaan Conradie
Thanks Piotr for a great post and for all those involved in developing this initiative, seems like a great idea and one that will help people keep people informed.
A few things I’m interested in: I’ve heard people saying that we are experiencing the worst drought since 1904 or in more a century (presumably the extend of observations being considered?), but I would be very interested over which area and using which data source this conclusion has been reached? I’ve seen the statement mentioned widely but I have not seen any reference to data or original research that led to this finding?
Also, I’m interested in why 1978 is the year that the available data here starts? Is this because of what is available from GCOS?
I’m also interested to hear what further data sources you intend to include in this initiative. It looks like a really great and exciting idea!
john Frame
My apologies. I didn’t see the scroll down!
Tom Brown
Very useful depiction of current vs historic rainfall patterns. Many thanks for the effort.
john Frame
Agree this is a great initiative. Please take the dates back to 2000 so we can see what happened in the 2004 drought
David Le Page
Very helpful, thanks! Have reposted elsewhere, and will continue to do so.
Jasper
Nice!
Here’s a similar initiative based on a high altitude station above the Theewaterskloof and Berg dams, including streamflow from Jonkershoek – http://www.ecologi.st/post/2017-04-01-Langrivier/
The more climate info out there the better!
Dave
Great initiative!