
At the end of last year I decided it would be interesting to calculate CSAG’s annual carbon footprint. Though it is simple enough to do a back-of-the-envelope calculation, I wanted to be a little more accurate and, as I soon discovered, it is by no means a straightforward task. Anyhow, after persistently emailing CSAG staff and students, and countless questionable assumptions, the results are in…
…but first I must thank everyone in CSAG for being so honest and helpful in the process.
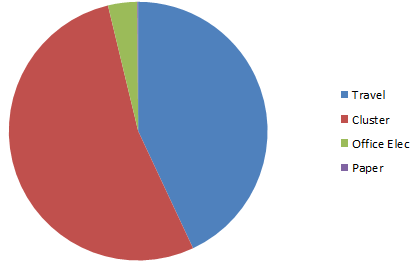
Headline message
In 2013 CSAG produced approximately 407 metric tonnes of carbon dioxide. Just over half of the emissions were the result of electricity and cooling for the computational cluster, 43% were the result of work-related travel (99% of which were from air travel), just under 4% were from general office electricity consumption and 0.125% were from the printer paper. Commuting, food consumption and waste were not included in these calculations.
Assumptions
Now, obviously the numbers quoted above are subject to a number of assumptions and simplifications. If anyone is really interested in this, please feel free to chat to me in person but for the sake of transparency and brevity (which may be a contradiction in terms), I will provide a list of the most important assumptions below:
- How to bound the scope of the research group and the work-related activities is a tricky issue. After much deliberation I decided to include all CSAG staff and students, including PhDs, Masters and Honours students. I also decided only to include emissions from directly work-related sources and personal energy consumption (e.g. flights for holidays) was excluded. Commuting to work sits in the fuzzy grey area between personal and work-related energy consumption, and much to the annoyance of the dedicated CSAG cyclists I thought it was best to exclude these emissions from the calculations. The contribution from commuting is unlikely to be negligible but equally it is unlikely to be close to the energy used for work-related travel. Other sources of emissions – e.g. food consumption – are somewhat difficult to calculate and again sit in the grey fuzzy zone, so for simplicity these were also excluded.
- The Eskom 2009 emission factor was used to convert electricity consumption into carbon dioxide emissions. This means that the carbon dioxide emissions calculated are directly related to the energy supply in South Africa – which, incidentally, is rather carbon intensive.
- It was assumed that all of the the energy used by the computational cluster is converted into heat that needs to be removed through cooling. Therefore, the power draw of the cluster was doubled to account for the air conditioning. We assumed that natural heat dissipation and inefficiencies in the cooling would cancel out.
- There are a plethora of website to aid in calculating emissions but the specific websites used for this study to convert travel into emissions were: http://calculator.carbonfootprint.com/calculator.aspx?tab=6 and http://www.travelnav.com/flight-emissions/
- I tried to contact UCT maintenance for accurate electricity usage for the building but didn’t get a response in time. Therefore I estimated the amount of electricity based on a quick audit of the CSAG offices. I used typical power values for laptops/desktops, lights, heaters etc and guesstimated how much they are used based on conversations with staff/students and a bit of common sense.
- Paper usage was again guesstimated to be 200 reams per year, based on a brief chat with Vuyo.
Comparisons
So how can we contextualise CSAG’s 2013 emissions? Well, one immediate thing we can do is compare CSAG’s emissions with other climate research institutes. According to this article, a few years ago, it was estimated that the UK Met Office HQ produced 12,000 metric tonnes of carbon dioxide per year. 75% of these emissions were attributed to the energy used by their supercomputer. These emissions are 30 times more than CSAG, but then they do employ approximately 30 times more people, so all in all we’re competitive!
CSAG’s emissions per capita for 2013 were 10.4 metric tonnes of carbon dioxide. This is the same per capita emissions as the Czech Republic in 2009. It is higher than South Africa’s per capita emissions, which was 8.8 in 2008, and the world per capita emissions, which was 4.9 in 2011. Of course if we were to include our personal energy consumption, we might be in the same league as the US but we would be hard pushed to compete with Qatar.
When calculating a carbon footprint, people often like to think about how many trees are needed to offset the calculated emissions. This is very contentious for number of reasons, not least because the calculations depend on the species and age of the trees as well as the location of the trees. But for the sake of argument, CSAG would need approximately 356,000 trees from a 25 year old white and red pine forest in the northeast US to offset its emissions; based on a tree sequestering 2.52 lbs of carbon dioxide in a year. For a 25 year old white and red pine forest in the same place, we would only need 64,000 trees.
How about some other comparisons? CSAG’s emissions are equivalent to the emissions of a 60W lightbulb if left on for 751 years – assuming it is in South Africa and the energy mix remains the same…we’d definitely need to find more coal. And finally, the emissions are equivalent to driving 45 times around the world in an average petrol car or 2.3 return trips to the moon.
…to conclude
The numbers calculated are only an approximation and a more thorough inventory would be required in order to provide more accurate results. Nevertheless, unless I have made a large error – which is of course possible – the total figure is likely to be of the right order. So the grand question that arises is: what should we do with the information? Should we use it to set targets for reducing our emissions in future years? Should we install some solar panels on the roof? Or maybe we should buy some land in Antarctica and move the computing facilities there (as long as we move the equipment on a wind/solar powered boat)? Perhaps we should think more carefully about ways to reduce our collective footprint. At the very least, and in the spirit of climate science, one of the first things we should do is understand and monitor current variability by performing the same calculation over the next few years.
We may justify our emissions by saying that as climate scientists we are working towards solutions to address climate change; and to a large extent I actually think this justification is appropriate. However, there are undoubtedly inefficiencies in the way we work and we should think about ways to reduce our emissions and limit our impacts on the broader environment. As a climate research organisation that aims to support societal decision making, we need to come from a position of strength. We certainly cannot be critical of others without first getting our own house in order.
But emissions and climate change policy aside, isn’t it about time we get our own CSAG lounge at Cape Town airport?!

(feature image from http://alpinmack.files.wordpress.com/2010/08/carbon-footprint.jpg)
Anna T
Very interesting indeed, useful to establish a baseline from which to track variability and change, as well as compare with other research units at UCT and beyond. It would be great if this becomes one of the metrics organisations get judged on and compete with each other. I realise carbon offsetting is contentious and can’t be the whole solution – widespread reductions are essential – but it could be a worthwhile part of the mix, especially if there is an explicit equity aspect built into the transaction. For example, there is a very good local carbon registry, Credible Carbon, that deals in carbon credits generated from projects in SA that also have a poverty reduction outcome. The interesting question then becomes where does the money come from for CSAG to buy the credits?
Joseph
Thanks Brendan.
1) The total number of flights – from 39 CSAGers – was 377 individual flights. I haven’t got the breakdown for short-haul versus long-haul but I’d say at least 30% of them were to/from Joburg.
2) You will probably get a better answer from CJ but the answer is yes. I don’t know how much the draw would be if there were no jobs running – maybe half?
And thanks for the UCT footprint, I had meant to include this. Interesting to see how much of a contribution food is!
Brendan Agrent
Nice wok Joe! Two brief questions:
1) Roughly how many flights did we total?
2) Is the cluster footprint dependent on usage?
By comparison UCT’s carbon footprint was estimated as 83 400 tons in 2007. And recently the food footprint was included, adding another 10% to that.
Joseph
I’d be keen to explore possibilities. I didn’t make the economic argument in the post but of course any way to reduce energy consumption also means reduced energy bills…which is always welcome.
peter
I see Bruce is in First Class, but isn’t he also flying the plane?! I’m sure we can rationalise and reduce our travel, but where are the possible reductions we can make with the cluster…natural cooling in winter? Or is the aircon not the main draw? What about a heat pump? Joseph, why don’t we set up an small subcommittee to investigate?
Joseph
Thanks Bruce, nothing was intended in the plane positions…honest!
Bruce
Sarcy positioning of the faces in the plane! 🙂
Great effort Joe … this is really useful.