The recent student protests have reignited a debate around university fees in particular, and education system in South Africa in general. That debate takes place through various channels, and one can hear or read a multitude of opinions on the topic in official ministerial and university communications, but also in social and traditional media, in meeting rooms, coffee rooms and corridors, and at the dinner table. So I thought it would be appropriate for our CSAG blog to contribute too. I’m actually surprised that we didn’t have any post addressing that issue before. I know, on the one hand fees are not climate, and climate is the focus of our blog. But on the other hand, we, as a group, quite often address topics such as ethics of research, role of research in society at large, we touch on philosophy, human nature and socio-economic paradigms. All of which transcend the physical climate science. I also realize that the fees topic is complex and charged and it is not easy to express opinions that are not controversial from some point of view (are there any?), and more often than not, we don’t want to stick our heads out to public scrutiny. Additionally, we are definitely more conversant in the objective, i.e. data, than in the subjective, i.e. opinions, and the matter of fees is a strongly opinionated issue. But perhaps our role here in the current discourse is to look at data?
Following the debate, I came across a couple of statements in defense of the need for maintaining the fees that argued that a free tertiary education in the context of South Africa would effectively subsidize the rich, and would not bring the expected benefit to the poor. The primary basis for this argument is that because the rich are a considerably larger proportion of the population of students than the poor are, getting rid of fees would benefit the rich more. So I decided to look at data.
Is the “free education is a benefit to the rich [compared to the current system]” statement true?
I’m afraid that the story to answer that question is a rather long one, so bear with me, please… Also, excuse my naive approach to macroeconomics.
First things first…
Firstly, of course we all have the understanding that education may not and will never be free. Simply, someone has to pay for it. You may not pay the university fees, but someone has to pay the costs of actually running the university. Fees or no fees, state coffers contribute to these costs, and all individuals in a country contribute to state coffers by paying taxes, both indirectly, though taxes embedded in the costs of products and services, and directly, through personal income tax.
In South Africa, in 2011 (I’ll explain why I focus here on 2011 later) the sources of funding of tertiary education were as follows1:
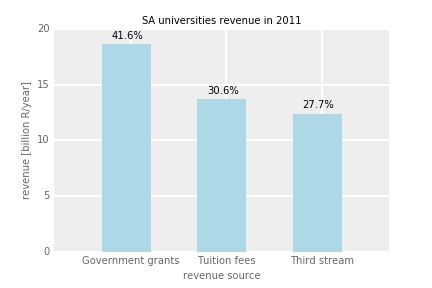
In this setting, tuition fees are contributed directly by individuals actually receiving training, but over 40% of the overall costs of this training is contributed indirectly by all taxpayers. There is also the “third stream” income which may come from selected individuals, groups of individuals (companies) or taxpayers (although not necessary South African), in the form of international research grants.
In 2011 total revenue of SA’s universities amounted to R44.9 billion. It should be noted that part of these cost went towards research, part went towards teaching, and part went towards administration and support. But we cannot separate the three. One cannot teach up-to-date science without conducting “cutting edge” research, and without someone actually running the institution and cleaning the classrooms.
Secondly, I need to explain what I understand as “benefit” in this context. Well, if one studies at a university, one receives a share of that R44.9 billion “package”. One can express it in relatively simple terms: since there were 938200 students at tertiary institutions in 20111, so on average, each of them received the benefit of R47857 of education costs, while paying from their pocket (or pockets of their parents) only R14602 in fees (surprisingly low average, I must admit). The balance was paid by taxpayers through the government grants and by the “third source”.
Individual contribution to one’s education through fees is a straightforward thing. You pay your contribution, you receive the benefit. As far as taxes are concerned, it is more complex, however. You pay, but not necessarily receive the benefit – what if you don’t study or don’t have studying children? You still pay taxes, part of which go to cover costs of someone else’s higher education. Now, we are in the realm of social justice here, so we won’t consider individuals any more, but rather groups of people (i.e. the rich or the poor). In this context, a group of people (say, the rich) pay tax, and that tax benefits members of that group, even though not all of the individuals in that group benefit directly. What is important here is that benefits can be redistributed between the groups, i.e. the poor may receive some benefits that are paid for by the taxes of the rich.
We can have two extrema here:
- a “radically egalitarian society”, where the benefits are distributed equally, independently on group’s contribution, i.e.:
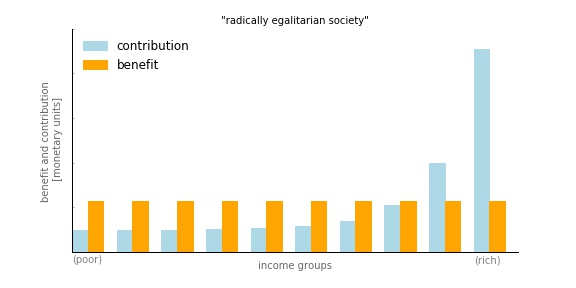
We can also present this through contribution to benefit ratio:
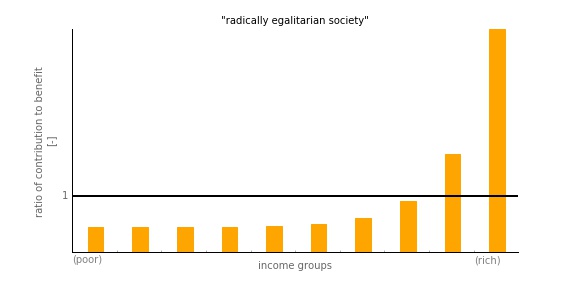
This situation expresses ultimate social justice, and it sort of underpins the communist economic system.
- a “radically equitable society” (perhaps there is a better term, but eludes me at the moment, but I hope you “get the drift”), where the benefits are distributed exactly according to group’s contributions, i.e.:
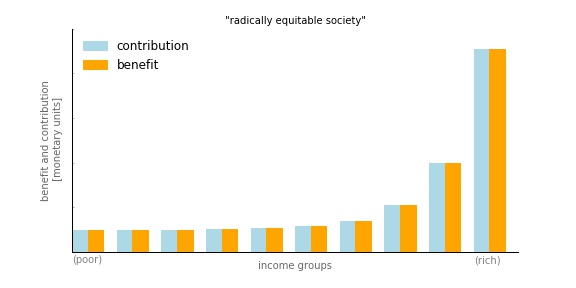
or again, when expressed in terms of ratio of contribution to benefit:
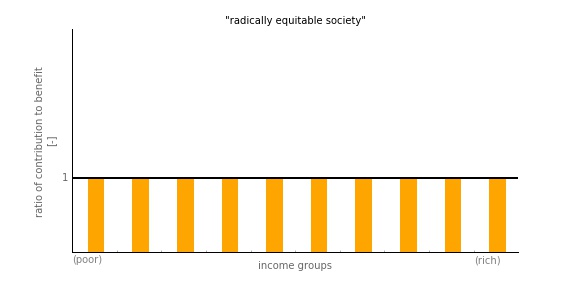
This situation, in turn, expresses ultimate economic justice, or an aggressively capitalist system.
The real societies are somewhere in between – the rich usually receive only a fraction of benefits paid for by their taxes, and some proportion of their contribution permeates to the poor.
Now, it is impossible to determine a “fair” level of redistribution in an objective way – there is a continuum between the “radically egalitarian” and the “radically equitable” with no significant, objective break points. What is fair from a social justice point of view, is not necessarily just from the economic one. What levels of social and economic justice a given state adopts is a matter of, basically, an agreement between taxpayers and the government negotiated through voting. This agreement manifests through the adopted system of taxation and the allocation of state’s budget.
So, in the context of SA’s (or any country’s for that matter) education system, the level of support of the poor by the rich is a matter of social or perhaps political contract between taxpayers and the government. Importantly, one cannot objectively establish a fair and just system (or at least I don’t see how this can be done). One can, however, use the above framing to compare two different systems, and conclude which one is more fair in terms of social justice. Or so I think.
To address the question posed earlier, in the above framing, I will thus try to do this:
1) get the income profile of students at SA’s universities,
2) determine contribution of various income groups to tertiary education through fees,
3) determine contribution of these groups through taxes,
4) determine the benefit each group receives in terms of total costs of education,
5) compare the above with a “would be” situation where there were no fees.
So without further ado:
Income profile of university students
Trawling through internet, I didn’t manage to find data on the income profile af SA’s university students, but I have found data on tertiary education expenditure of households. I think it is OK to treat it as an indirect expression of what economic backgrounds do the students come from. These data are from SA Statistics’ “Income and Expenditure survey, 2010-2011”2. Since these data are key to the whole story, for consistency sake, I have “pegged” all analyses and data to 2011. I know, things might have changed in the last 5 years, but it doesn’t look like they have changed strongly.
That income-expenditure survey is based on reports by a number of households of their income and expenses, and the results are presented by categories of household income (and alternatively, expenditure). These categories are income deciles. There were 13 112 000 households in SA in 2011, so the 1st decile covers 10% or 1 311 200 households with lowest income, 10th decile 1 311 200 with the highest income.
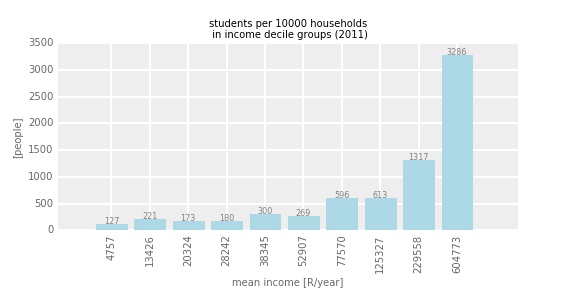
The survey does not report the range of incomes within each decile, only the mean decile’s income. This is how this looks like:
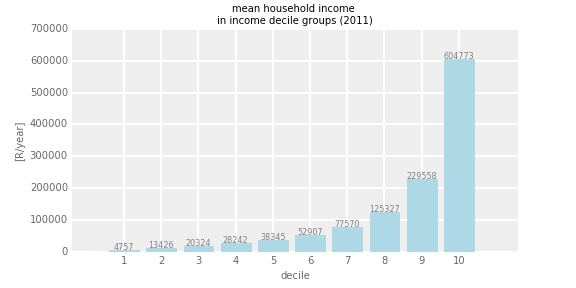
The lowest decile’s (the poorest 10% of households) mean household income is ~5000 R/year, while the richest households have income of ~600000 R/year.
Their reported expenditure on tertiary education is as follows:
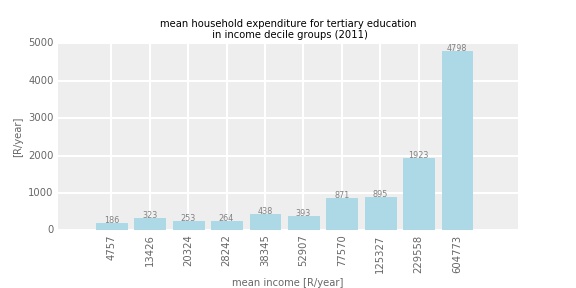
So the poorest households spend only 186 R/year, while richest 4798 R/year on tertiary education.
That’s not very informative, so perhaps I will be able to translate these values into the number of students participating in tertiary education from each income group?
But, unfortunately, this is where I hit a problem – the figures don’t match exactly, and I need to make some assumptions and simplifications. Let me explain. In 2011 there were 938 200 students registered at tertiary educational institutions. The total revenue of the universities from fees was R13.7 billion. The total household expenditure for tertiary education was R13.6 billion, which match pretty exactly the universities income from fees. However, apart from individual’s fees, there is also NSFAS funding, which in 2011 amounted to R3.7 billion3. This source of funding is not likely to be reported in the household expenditure survey, as the NSFAS funding is channeled directly to universities. It is, however, likely, that the tertiary education expenditure (self)reported in the household expenditure survey includes not just fees, but also “extras” such as transport, accommodation etc. I have no data to determine levels of that possible over-reporting and to distribute them amongst the groups. What additionally complicates things, is that only part of the actual university fees due in any given year are actually received, and the outstanding fees usually amount to around 20% of total fees due. It seems to me that the tertiary education budget in my data source1 does not reflect the unpaid fees. How do I account for all these? I don’t.
Pragmatically, I just consider that household expenditure survey reflects the effective out-of-pocket direct contribution of various income groups towards the tertiary education. Since the answer to the primary question posed here is not concerned with individuals, but with income groups, from the objective of this story it doesn’t really matter how many students originate from each group.
However, purely for illustration, I have calculated an approximate number of students in each income group by dividing the total household expenditure of each group by mean tuition fee. I admit, this does not reflect the number of students in each of the groups accurately. This is because universities differ in the tuition rates. The more expensive universities are likely to attract richer students. The cheaper universities will naturally attract the poorer. By doing the calculations as above, I’m effectively underestimating the number of students from poor households, and overestimating the number of students from rich households. Considering this caveat, this is how the situation looks like:
Clearly, the South African tertiary education system is not an egalitarian one. But is it what I call “radically equitable”, i.e. is the benefit that each of the income groups draws from tertiary education proportional to their contribution through fees and taxes?
Direct contribution to education through fees
Direct costs of obtaining tertiary education, i.e. costs incurred by fees, can be calculated by multiplying mean household expenditure times the number of households, and are as follows:
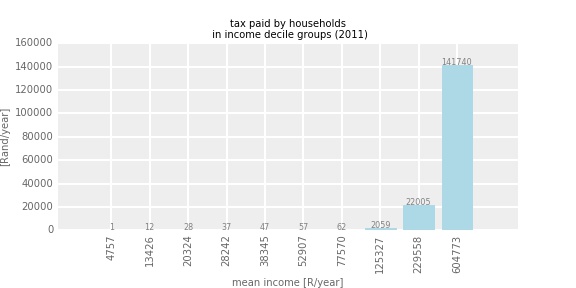
Indirect contribution to education through taxes
To calculate the indirect contribution of each income group to tertiary education incurred through taxes I have used SARS data4, and focused here on the income tax. There are of course other forms of tax, such as VAT, but they are proportional to the income tax, i.e. the richest groups pay the most of it anyway, so not accounting for them is not likely to invalidate the final outcome. The process is rather winding, and thus for the sake of space and your time, I refrain from illustrating it here at length. I’ll be happy to provide anyone interested in the details, though. Basically, I have converted the assessed tax for various personal income groups to the tax paid by the various household income groups. In that I have considered that the household income reported in the income-expenditure survey is the after-tax income and that it is equally shared between two breadwinners per household, who pay individual taxes on their incomes. The tax picture looks as follows – in terms of income tax paid per household:
and in terms of total income tax paid by the income group:
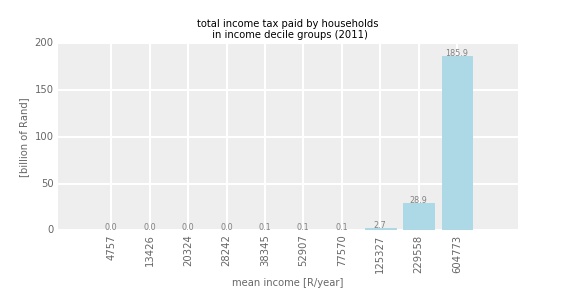
I consider now, that each income group’s contribution to the tertiary education funding is proportional to the income tax paid by that group. In effect, this is each group’s share in the government funding of the universities:
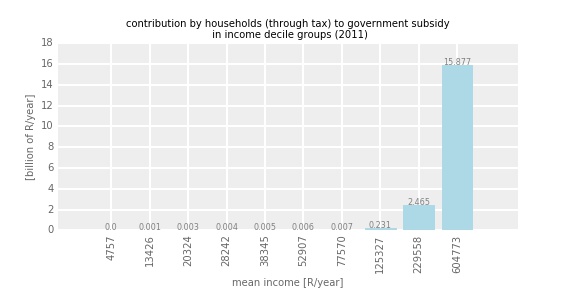
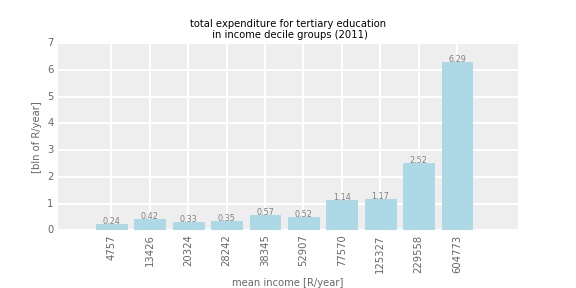
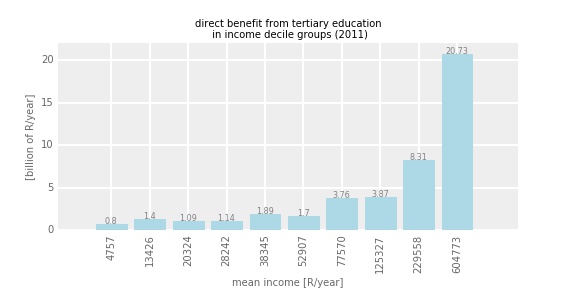
Benefit from tertiary education
We can now calculate what is the total benefit per each income group received in the form of tertiary education. This should in theory be calculated by dividing the total costs of tertiary education (R44.9 billion) per number of students in each of the income groups. However, as mentioned earlier, my calculations of the number of students were biased. However, we have to consider that students from higher income groups are likely to pay higher fees, but also ultimately, receive a higher proportion of the total benefit, i.e. higher fraction of the R44.9 billion. That fraction will likely be directly proportional to the magnitude of their fees. So at the end, it doesn’t matter how many students are there within each group, as the benefit will be proportional to the fees. There is another implicit assumption here, that the distribution of the government subsidy to the individual universities is also proportional to the magnitude of fees the universities charge. Which I guess is not unreasonable.
The distribution of benefit from the tertiary education looks like this:
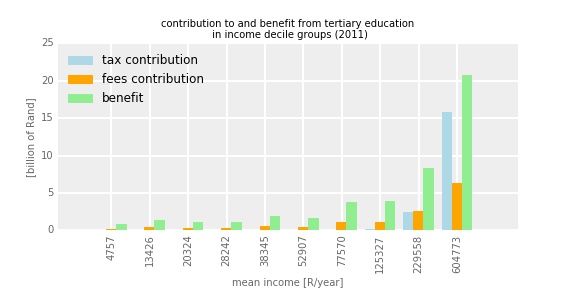
Costs and benefit under current and “no fees” system
In the current system, the benefit, fees contribution and tax contribution of each of the groups, put together, give us:
Now, finally, we can calculate, what I term, a ratio of contribution to benefit arising from participating in tertiary education, per each income group:
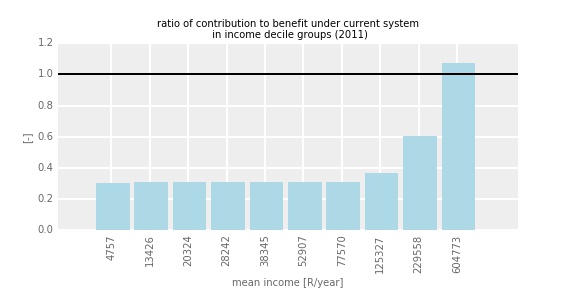
The black horizontal line in this figure indicates level where what one puts is equal to what one gets in return, i.e. where contribution balances benefit. It is clear that the rich contribute more than they actually get back, and that the poor contribute less than they actually receive. Which indicates that there actually is some redistribution of benefits in the current SA’s tertiary education system. As I was mentioning earlier, it is impossible to objectively state whether this level of redistribution is just, as there are no objective measures of such (or at least I cannot think of them).
And finally finally, I’m able to compare two funding models: current one, which is based on fees and taxes, and the “no fees” one, which is based entirely on taxes. For the latter I consider that the household income group’s benefit is as it is currently, but their contribution is proportional to their current contribution through taxes. The result:
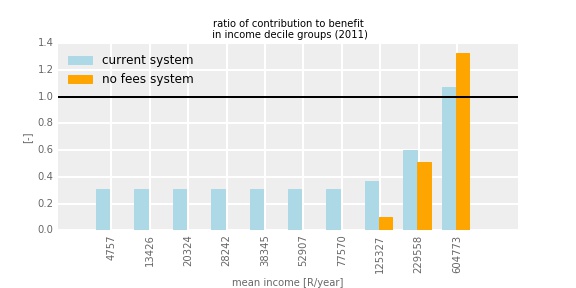
From this figure is it clear that under the current system, the poorer part of the society pays higher fraction of costs of their group’s education than it would, if the education was “fees free”, i.e. paid entirely through taxation. The implication is that the statement that “fees free” education would subsidize the rich is not true.
I’ll restrain at this moment from commenting on the implications of the result in the current fees discourse. Please note that I’m not proposing that education is fees-free, nor that the fees should be maintained. I am also not suggesting that fees-free education should be provided by increased taxes, or by restructuring the current budget. I’m merely stating that under the relatively simple set of principles, and based on available tax, fees and participation data, the hypothesis that “no-fees education would unfairly benefit the rich [compared to current system]” does not seem to hold.
Disclaimer!
This is all calculated assuming current (2011) structure of taxation, and current (2011) income demographics of university students. We have to remember, however, the couple of caveats of the calculations:
– I’ve assumed that students pay uniform fees across the universities (they don’t) and across the income groups (they don’t),
– I’ve considered the effective expenditure on tertiary education, i.e. expenditure reported by households in the income-expenditure survey as an expression of the direct contribution through fees and income group participation in tertiary education,
– I’ve implicitly considered that the “third stream” and “tax” contribution to the education’s benefit of a given group is proportional to that group’s contribution through “fees”
– I’ve not included NSFAS funding explicitly, and thus it is implicit in the calculations that the benefit arising from NSFAS funding is distributed similarly to other two sources of benefit. Which it is not in reality – poorer households likely receive more NSFAS funding.
– I’ve used a relatively simple model of a household, with two equally earning breadwinners, which is not likely correct across various household income levels.
I’ll gladly amend the calculations with appropriate data that would allow to avoid making the above assumptions. If anyone points me to such, that is.
Data Sources:
1 PWC, 2014, A review of annual reporting by South African public higher education institutions, 2010-2012.
2Income and Expenditure of Households, 2010/2011, P0100 Statistical Release,Statistics SA
4SARS Stats 2011, Tax Statistics Personal Income Tax, SARS
3NSFAS 2014/2015 annual report, NSFAS
Cover image source:
www.abovethelaw.com (pun not intended, and please, please good lawyers from abovethelaw.com, do not sue me!)
Peter Johnston
Brilliant blog Piotr. Needs some serious consideration, but undoubtedly thought provoking….
Fees must fall…but to where?
olivier
Impressive data demonstration, with which concept I agree (I come from a fee free education system, and at least they did not the most terrible job (I hope?)). I would actually be more radical in not only hoping for a Fee Free education, but to make the “ratio of contribution to benefit” so that the median income group would have a ratio close to 1 (and not the highest one). But this is not my point.
I believe the ‘financial’ demonstration is not enough though opposing a major argument advanced against Fee Free Education (http://mg.co.za/article/2015-10-28-free-university-education-is-not-the-route-to-social-justice) which is not questioning the feasibility but the ‘education access’ (excuse my French).
If I try to relate it to your numbers, now looking at your ‘student per 10,000 households’, one can look at it as a lack of access to education.
If the number of kids per households was constant (and it would not in reality, only emphasizing further the point), and the same number of those kids per household was in age to get a tertiary education (as it should I believe), then 127 ‘accessed’ this education in the lowest decile for 3286 in the highest decile. Yes, and you demonstrated it, Fee Free Education benefits more the lower decile students than the higher ones, but it does benefit more the 127 that accessed education in the lowest decile, compared to the 3286 that did in the highest.
How to get the 3286-127=3159 kids from the lowest decile which should be in a tertiary institution as well into one? Could the Fee system be a tool in addressing the access?
My current state of mind (changing to often for my own sanity) is that to get equitable access to quality tertiary education, kids must get equitable access to quality secondary education, and you guessed it, equitable access to quality primary education. And here is a clear belief, I cannot imagine a education system of quality equally accessible to all that is not Fee Free.