
At this stage we all know the context, and I don’t think there is a need for extra explanations. So let me be as brief as possible.
Drought.
Big city.
Disaster management plan.
Day Zero.
Everyone blames everyone.
There. You have it.
From my perspective (rooted in data and facts) the time has come to assess, with some level of certainty, the prospects for the next months. It has come because the rains have effectively ended and dams are not likely to receive any substantial amounts of water till the next rainy season. As a guy from another big city long time ago said Alea iacta est, or in other, more modern words, WYSIWYG – what you see is what you get.
A couple of days ago, Tony Turton has published a story about decision making, resource management and the role of water in society and economy, and politics, of course, accompanied by a projection of Cape Town’s dams storage. I might agree with him on a couple of points and disagree on some others, but what attracted my attention is the dam storage projection. And I felt that it might need further unpacking. So let’s focus for a moment on accounting. No, I haven’t crossed to the enemy’s camp – it will be water accounting, of course.
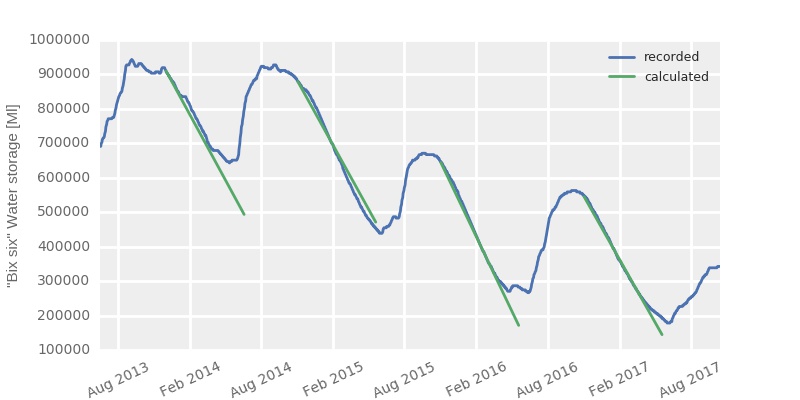
At this stage, we are very familiar with graphs illustrating storage of dams supplying the City of Cape Town (CoCT). Here is my take on the dam storage plots:
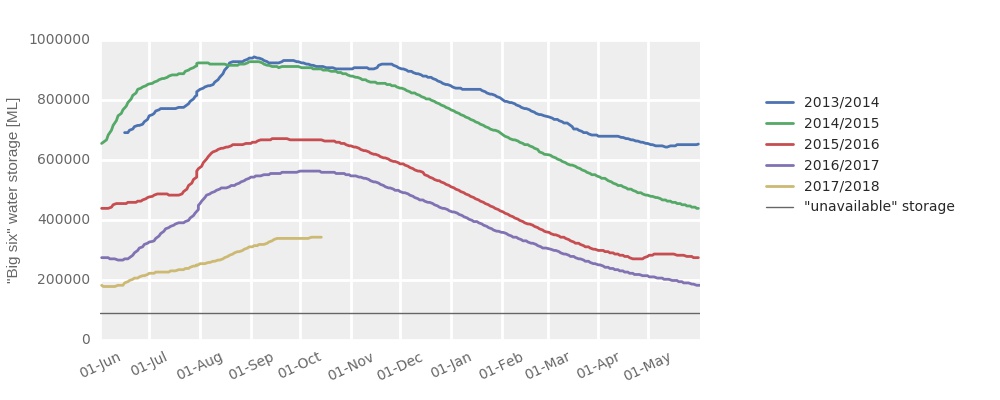
I’ve plotted the above in a slightly different manner than what we are all used to. The “year” starts on 1st June, and ends on 31st of May. This is because it is roughly in June that a new “water year” starts in Cape Town. Water from May-September rains has to last till roughly June next year. “Roughly” is the key word here. One can see from the graph above, that dam storage first stops declining slightly, and then recovers abruptly, at different times of the year. In 2016-2017 the decline continued till the second week of June, in 2014-2015 – till the first week of June, in 2013-2014 till the second week of May, and in 2015-2016 till the last week of April. The recovery happens as early as the beginning of June (as in 2014-2015) or as late as mid July (as in 2015-2016).
That’s very important information in our current context, because (as I show below) that strongly affects the prospect of the dreaded Day Zero.
Another information one can get from the above graph is that the October-May decline rate is different between the years. This is likely due to several reasons. Firstly, different levels of water abstractions (effectively of water use). Secondly – influence of evaporation. Thirdly – influence of summer rains. The 2013-2014 was likely strongly affected by summer rains. In other years, summer rains seem to have very limited impact on dam levels.
Here is a graph of CoCT water use plotted in the same way as the dam levels above:
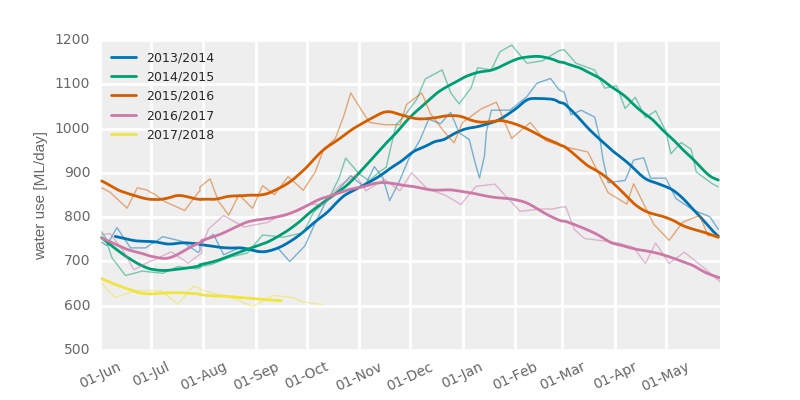
Here, thin lines show data as available from the CoCT, thicker lines – are just a smooth of the original data. We can see that water use pattern and overall magnitude changes from year to year. The effects of CoCT campaign to reduce water use are amazing in 2017. Kudos to all of us (Capetonians, that is) who save water.
Now, I can build a simple model of the dam storage decline that will let me take into account different levels of water use. I will later use that model to determine the expected rate of decline this year.
The simplest model is like this:
St+1=St-Qt
or for the mathematically challenged:
Dam storage tomorrow equals Dam storage today less Water use today
The above calculation is carried out for each day between October and July in 2013-2016. This is what it gives us (when plotted on the “traditional” dam storage graph:
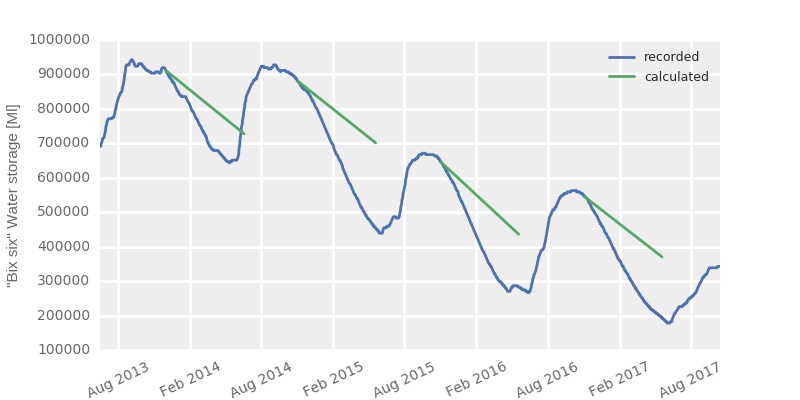
No match between the model and observations, of course, because CoCT is not the only “client” of the dams. The Western Cape Water Supply System (WCWSS) operating the dams supplies CoCT but also region’s agriculture and several smaller municipalities. The oft-invoked water use of 600 Ml per day pertains only to CoCT. And we should not forget one more “client” – the atmosphere, “taking” water through evaporation from dams.
I couldn’t find data on the exact use of water by agriculture and the municipalities. What I found is this:
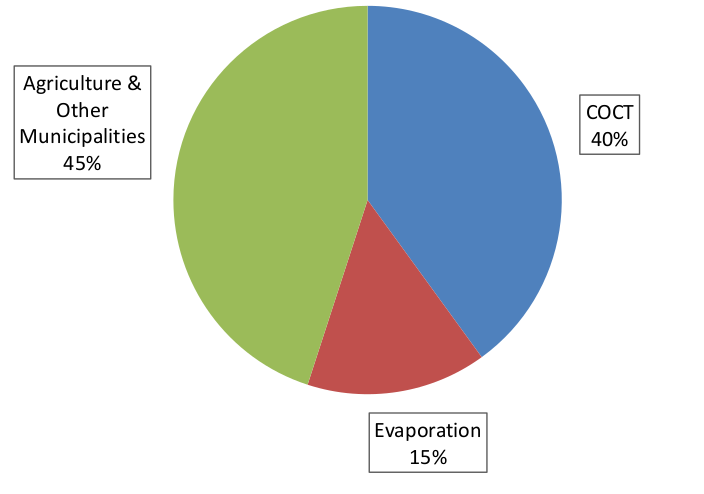
For the next, improved model, I assume that the “agriculture and other municipalities” use is proportional to that of CoCT. This means that if CoCT currently uses 600Ml per day, then “agriculture and other municipalities currently draw 675Ml per day (based on the figure above they use 112.5% of what CoCT uses. Trust me, or do the maths yourself). That is a rather crude and uninformed assumption, but this is the only thing I can do without getting into days of negotiations about getting access to actual data that may or may not exist.
I also consider that the 15% of evaporation in the above figure is calculated as 15% of “normal” water use, i.e. water use in the 2013-2015 period. This gives me 135 Ml/day of evaporation. Quite a lot, actually, almost 30% of what CoCT would want to use. But that’s a different story altogether.
The “improved” model is thus as follows:
St+1=St-Qcoctt-Qothert-Et
where Qcoct and Qother are daily water use of CoCT and “other” users respectively, with:
Qothert=1.125*Qcoctt
The results of this model look as follows:
and are remarkably good, considering the crudeness of calculations. There are a couple of differences between what I calculate and what was observed. My calculations give me almost straight lines, the observed decline line is usually a bit concave. This is likely because of changes in evaporation. As dams store less water, there is lower surface area and thus less evaporation. Also, evaporation is a function of air temperature, and that changes throughout the season. In my model, evaporation is always constant.
Additionally, factors such as infiltration to groundwater, summer rains and dam operation (i.e. how fast each of them is emptied) might play a role in shaping the decline of dam storages. I don’t think I can resolve all those in a morning, so let’s stick to the model that we have now. It’s good enough.
Now, to the crux of the story – i.e. the next months.
Here is a graph that shows a couple of “projections” that are based on the above model:
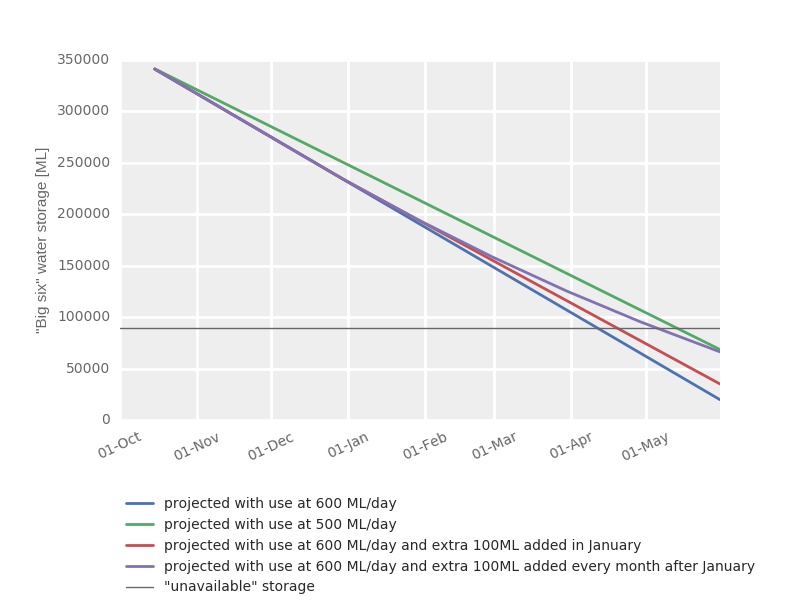
We can see what happens when we use what we use now, i.e. 600Ml/day, or when we reduce the use to 500Ml/day (that does not apply just to CoCT, of course, agriculture use and other municipalities use must drop too). Also, we can see what happens if we (I mean CoCT, or WCWSS here, of course) start supplementing the supply. A single additional source of 100Ml/day switched on in January. Or several sources, each of 100Ml/day, going on-line progressively on the first of January, February, March, April, May and June.
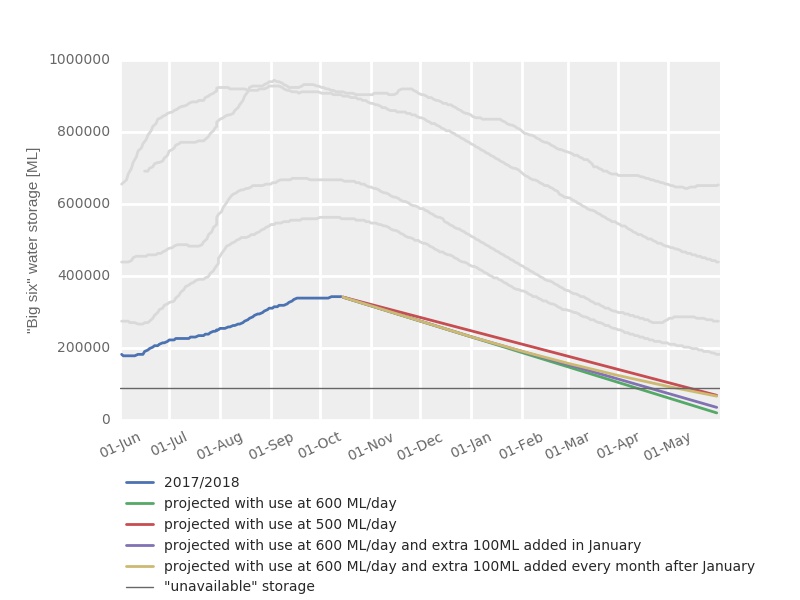
As a bonus – let me throw in the last graph that is essentially the one above put in the context of the previous years:
Let us ponder…
Dian Spear
Thanks for this Piotr! Really useful. I wonder how it could be put into some nice simple and compelling communication products (ACDI comms team??) –
infographics or video that could be shared on social media.
Peter
Great analysis Piotr!
Perhaps we could see what happens if agriculture uses the least possible to retain current production, as the benefits there are enormous. I’d happily make do with less water than see people losing jobs and livelihoods.
Monica Rockstroh (Giermek)
Great plots and write up, Piotr. I wish I was around the EGS building for lunch time in the courtyard this year to hear what you and all the CSAG folks are thinging/ researching on the drought. Grateful for these blogs so I can tune a bit from over here in Chicago.
Genito
Really great job, Piotr!!!
That also applies to some other cities in Southern Africa. The difference being that for cities like Maputo, for example, the dam storage (for tomorrow) seems to be promising with the coming rains… however we can’t help being nervous with a possible Day Zero as well.
Rodger
Of course a big assumption is that Agri use can change in line with CoCT without significant negative impact…