The Context
CSAG participated in a number of side events at the recent COP 17 meeting in Durban. A climate change decision game featured in three of these side events. Although each event had a different focus, the outline of the game remained consistent for each audience. The game relied on the active participation of delegates at the COP meeting and was developed to communicate two key messages. Firstly, decisions regarding climate change adaptation are sensitive to multiple and often conflicting sources of information which are rarely, if ever, limited to climatic factors alone. Secondly, and perhaps of more relevance to the developing climate services agenda, the precise manner and form in which climate information is communicated can effect the eventual decisions that are made. It should be highlighted that much of the effort that went into designing and running the game can be attributed to Chris.
The Game
Each member of the audience assumed the role of a local authority planner for a predominantly agricultural area in southern Zambia. In this role each individual had to consider the possibility of increasing drought frequency and/or severity resulting from climate change. The audience was told that a once-off offer for $5 million had been made available by a donor to match an investment of $5 million from the local authority budget to build of a dam and irrigation system as an adaptation response; this adaptation response was deemed to be the most appropriate available response (a contentious issue in designing the game but we proceeded nonetheless). Given various sources of information, each individual then had to decide whether or not to go ahead and invest in the dam and irrigation system.
There were six stages to the game. In each stage, the audience was presented with different pieces of information which were relevant to the decision. Most of the information was related to climatic factors such as rainfall observations and temperature projections but some pieces of information concerned social and cultural elements. The information was extracted from various climate decision portals in addition to links from a Google search and the personal views of “experts”. After each stage the audience members had to decide whether they would vote “YES”, “NO” or “I NEED MORE INFORMATION”. If they decided YES they held up a green card; if they decided NO they held up a red card and if they decided that they needed more information in order to reach a decision, they held up a yellow card. After the final stage audience members could no longer request more information and they had to make a YES/NO decision. Inherently the game was designed so that the decision was sensitive to multiple considerations and any sense of a “right” course of action was unclear.
The Results
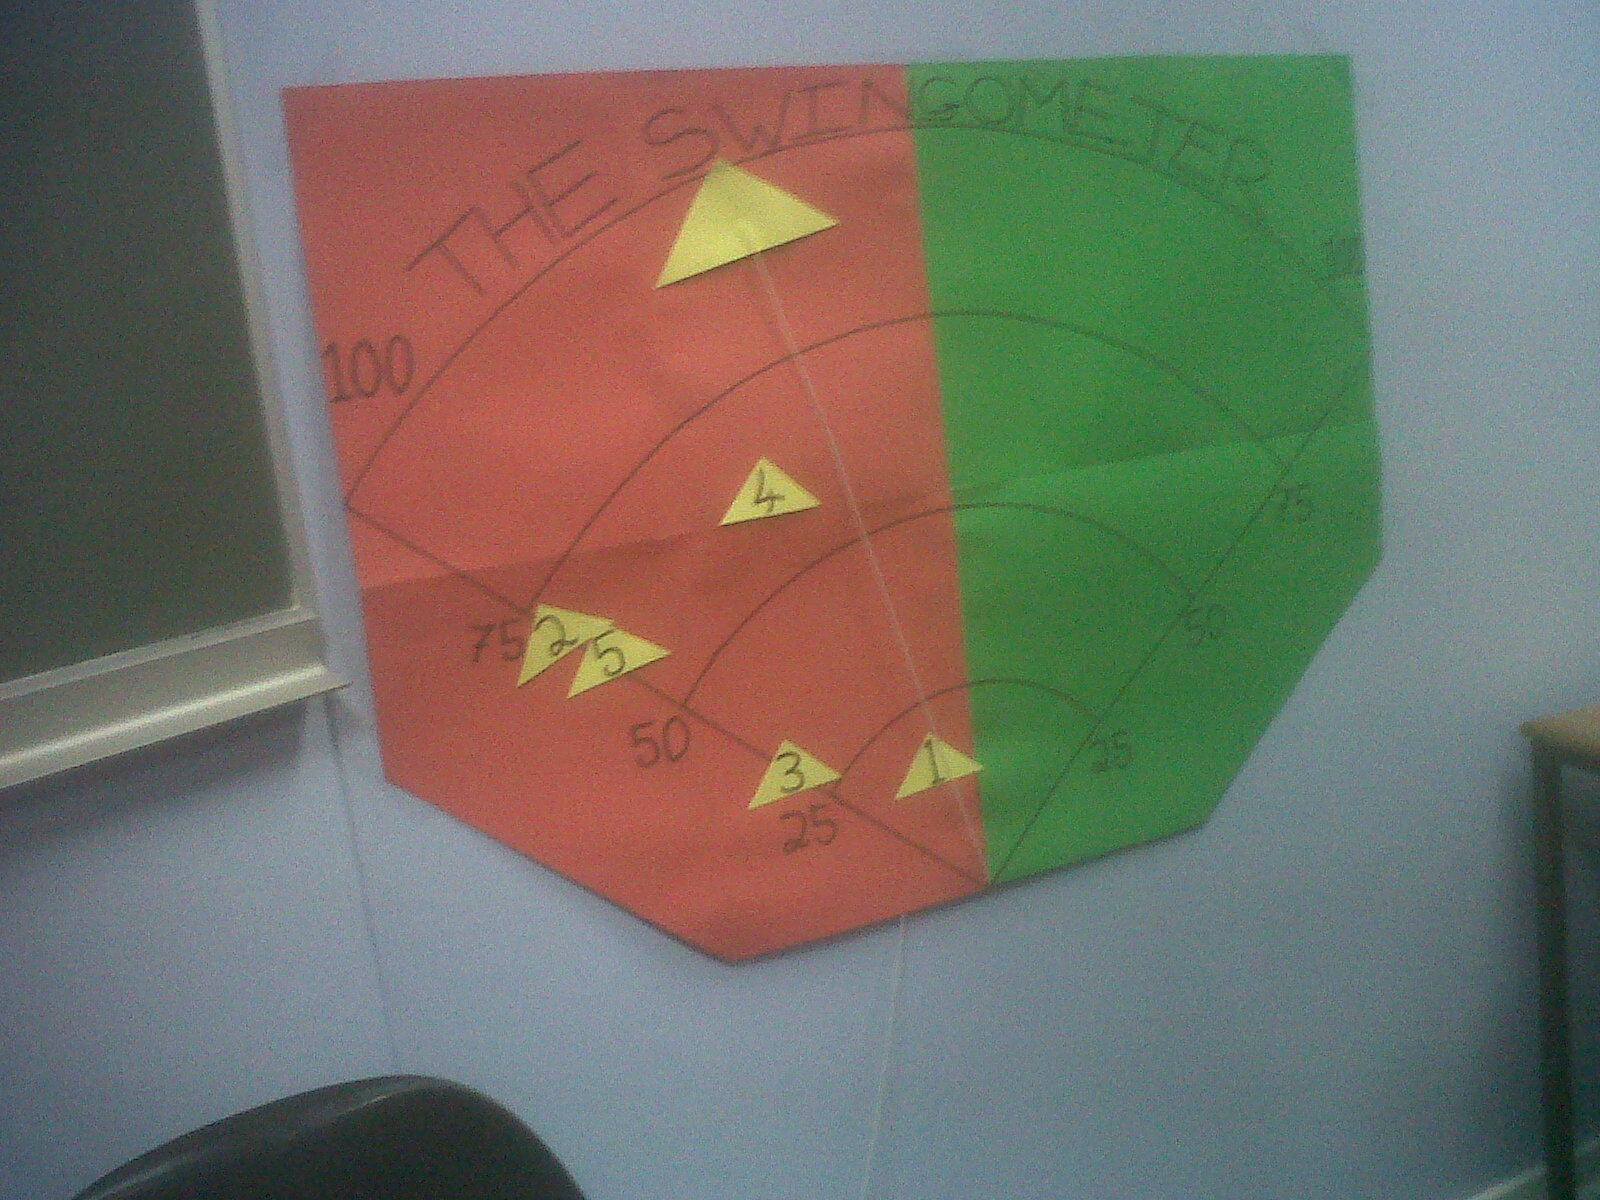
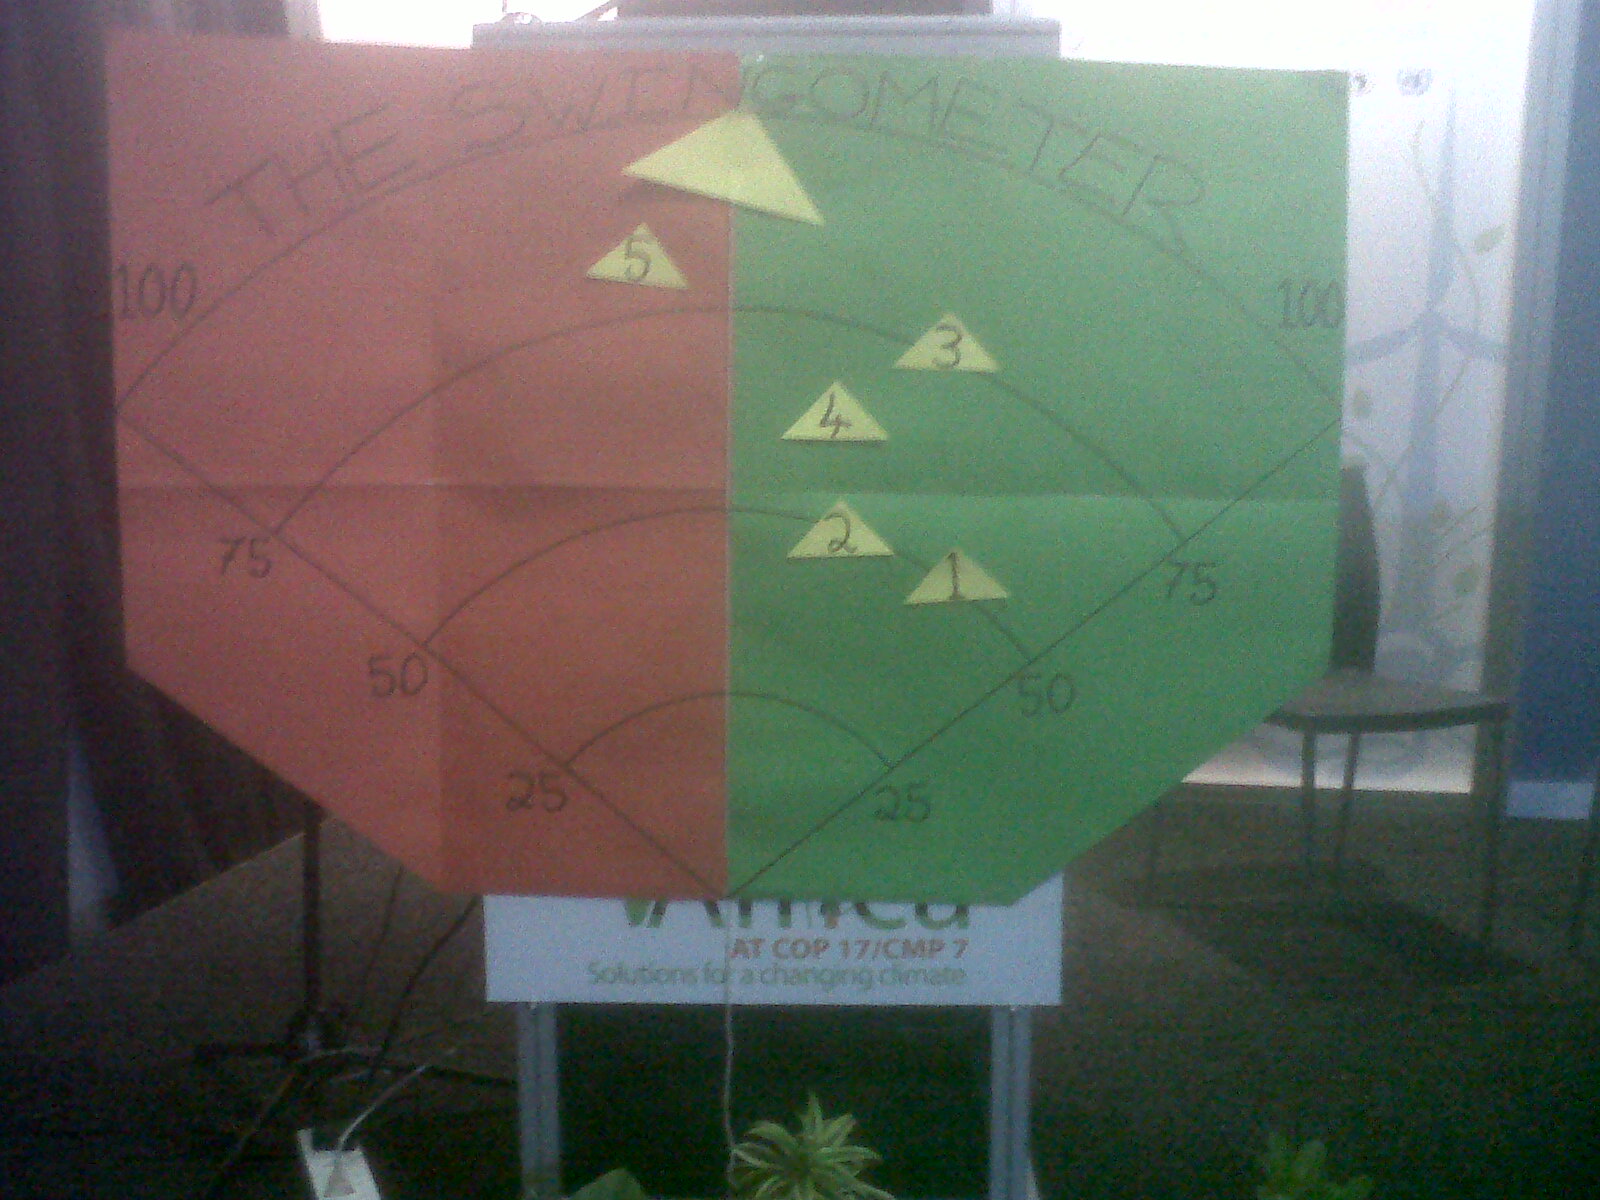
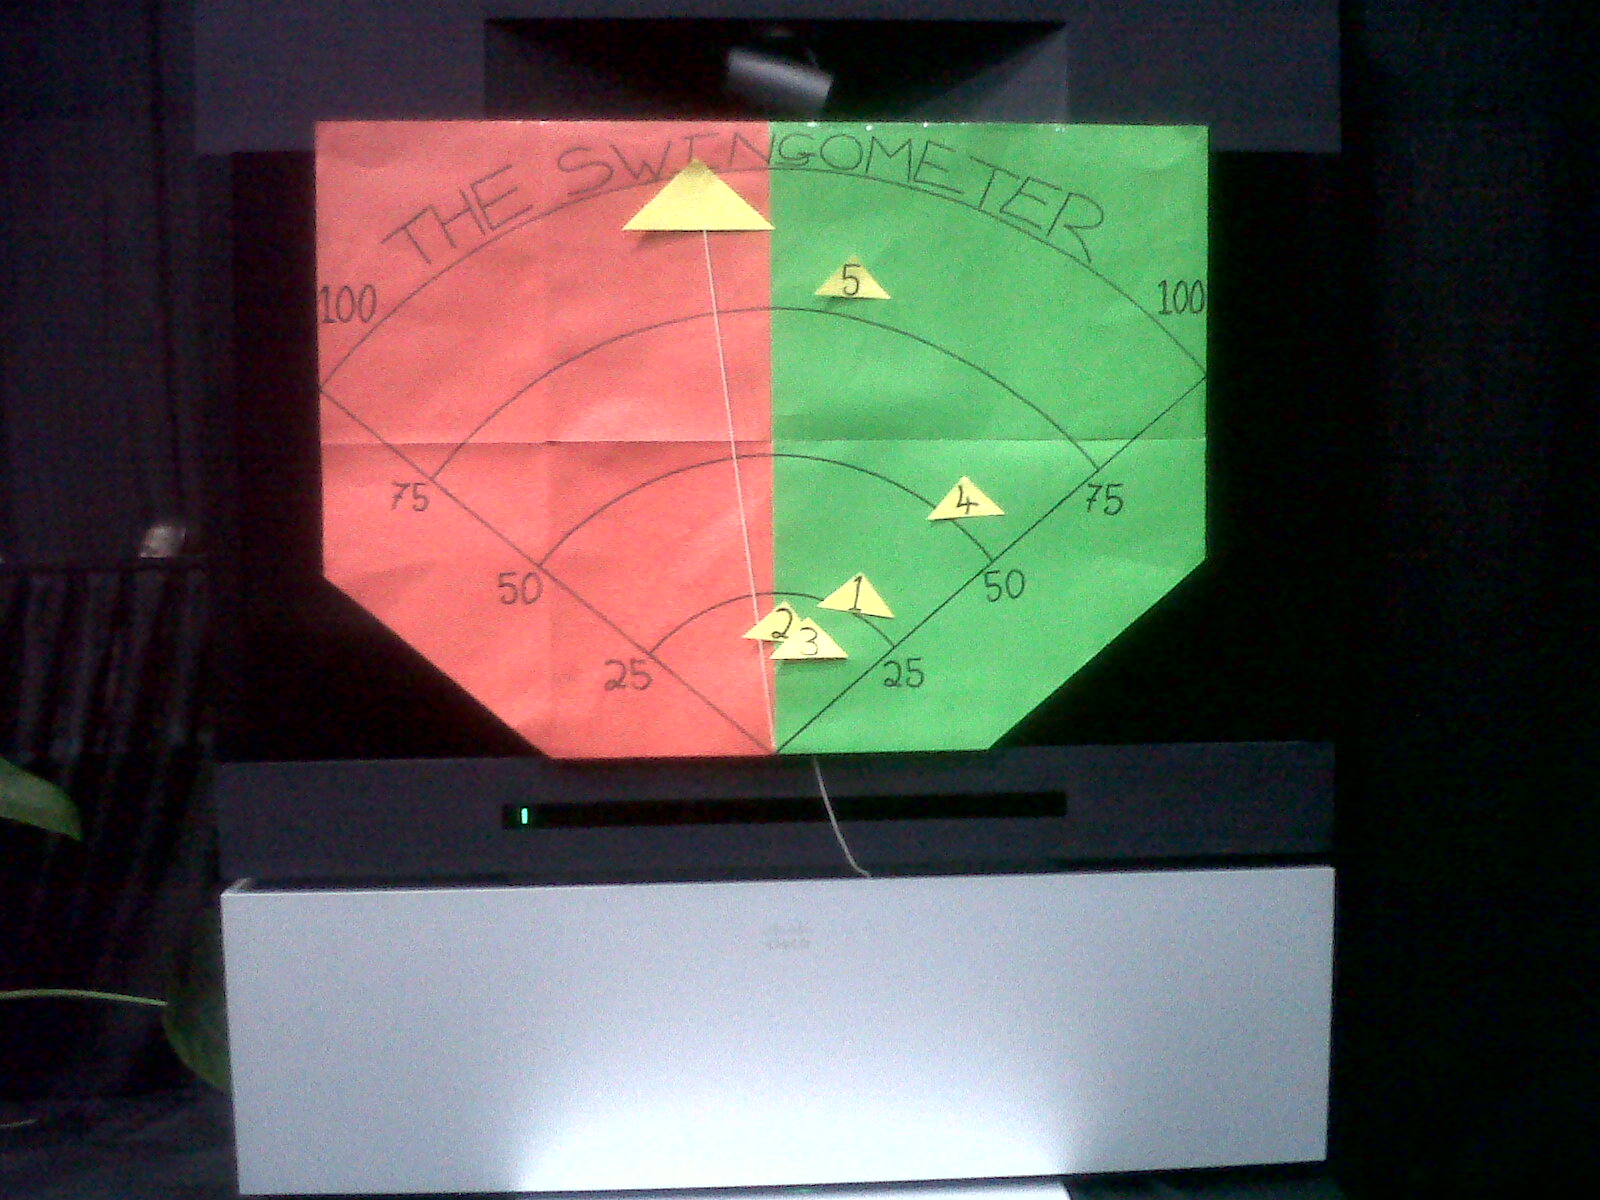
A “Swingometer” was used to track the decisions of the audience on each occasion that the game was played. As a tool gratefully borrowed from the coverage of the UK elections, the Swingometer showed the swing of the audiences decision. If more people voted NO, the arrow would swing into the red and if more people voted YES, the arrow would swing into the green. The images below show how the audiences voted over the three games. The concentric lines track the percentage of people who actually made a decision (YES or NO). The final position of the arrow shows the final vote in which everyone was forced to vote either way.
Game 1 Game 2 Game 3
Analysis
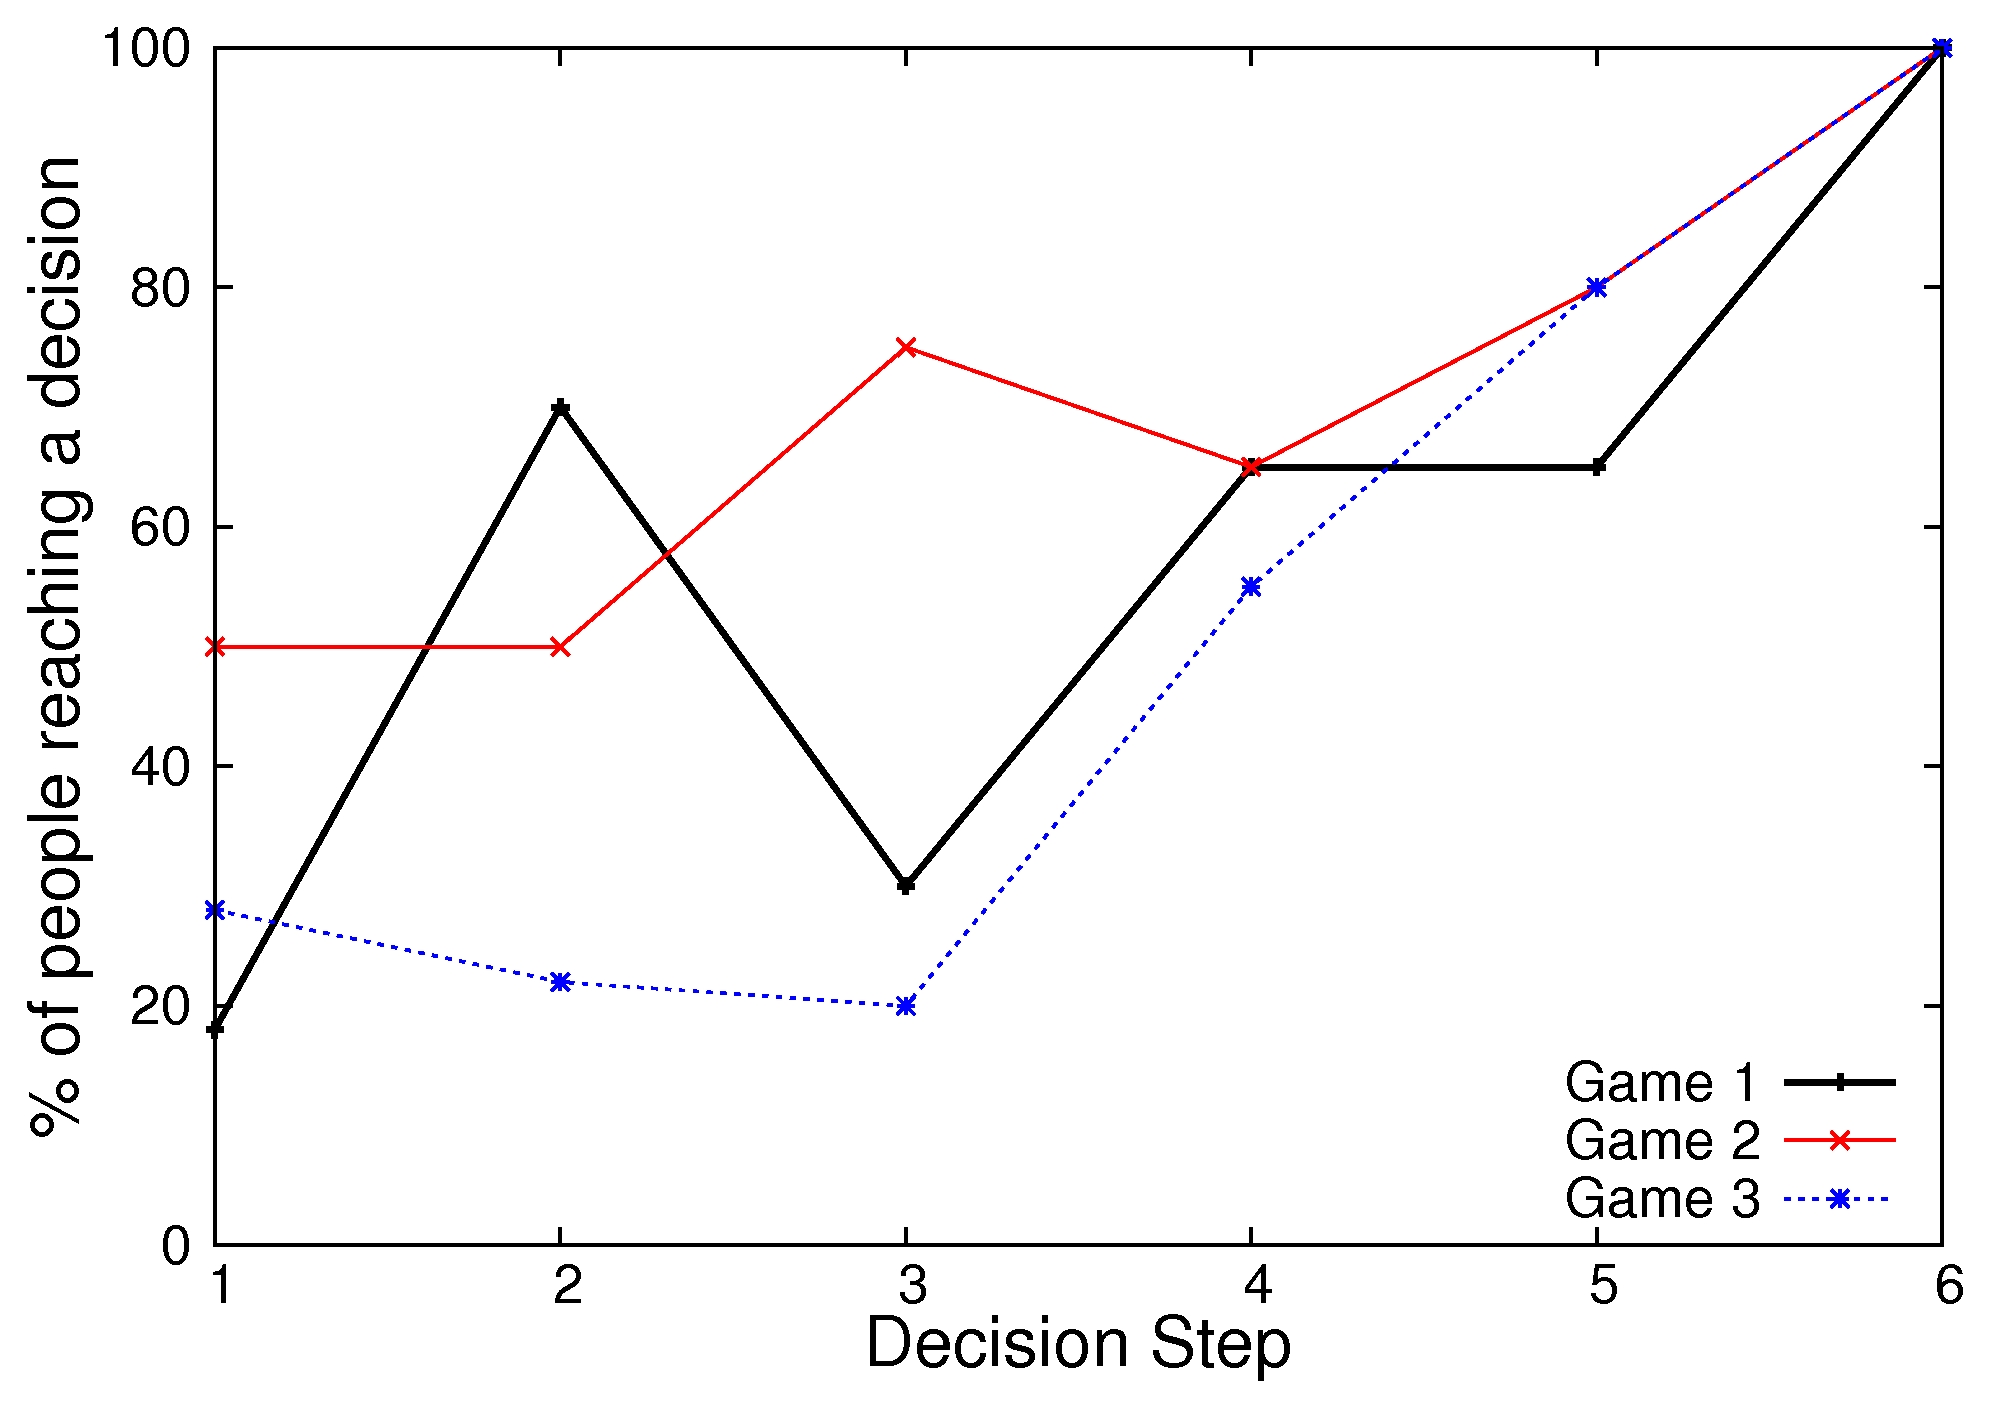
As a scientist I couldn’t resist the opportunity to plot the results. The graph on the left shows the swing of the result (y-axis) at each decision step (x-axis) over the duration of each game. The graph on the right shows the percentage of people making a decision (y-axis) at each decision step (x-axis).
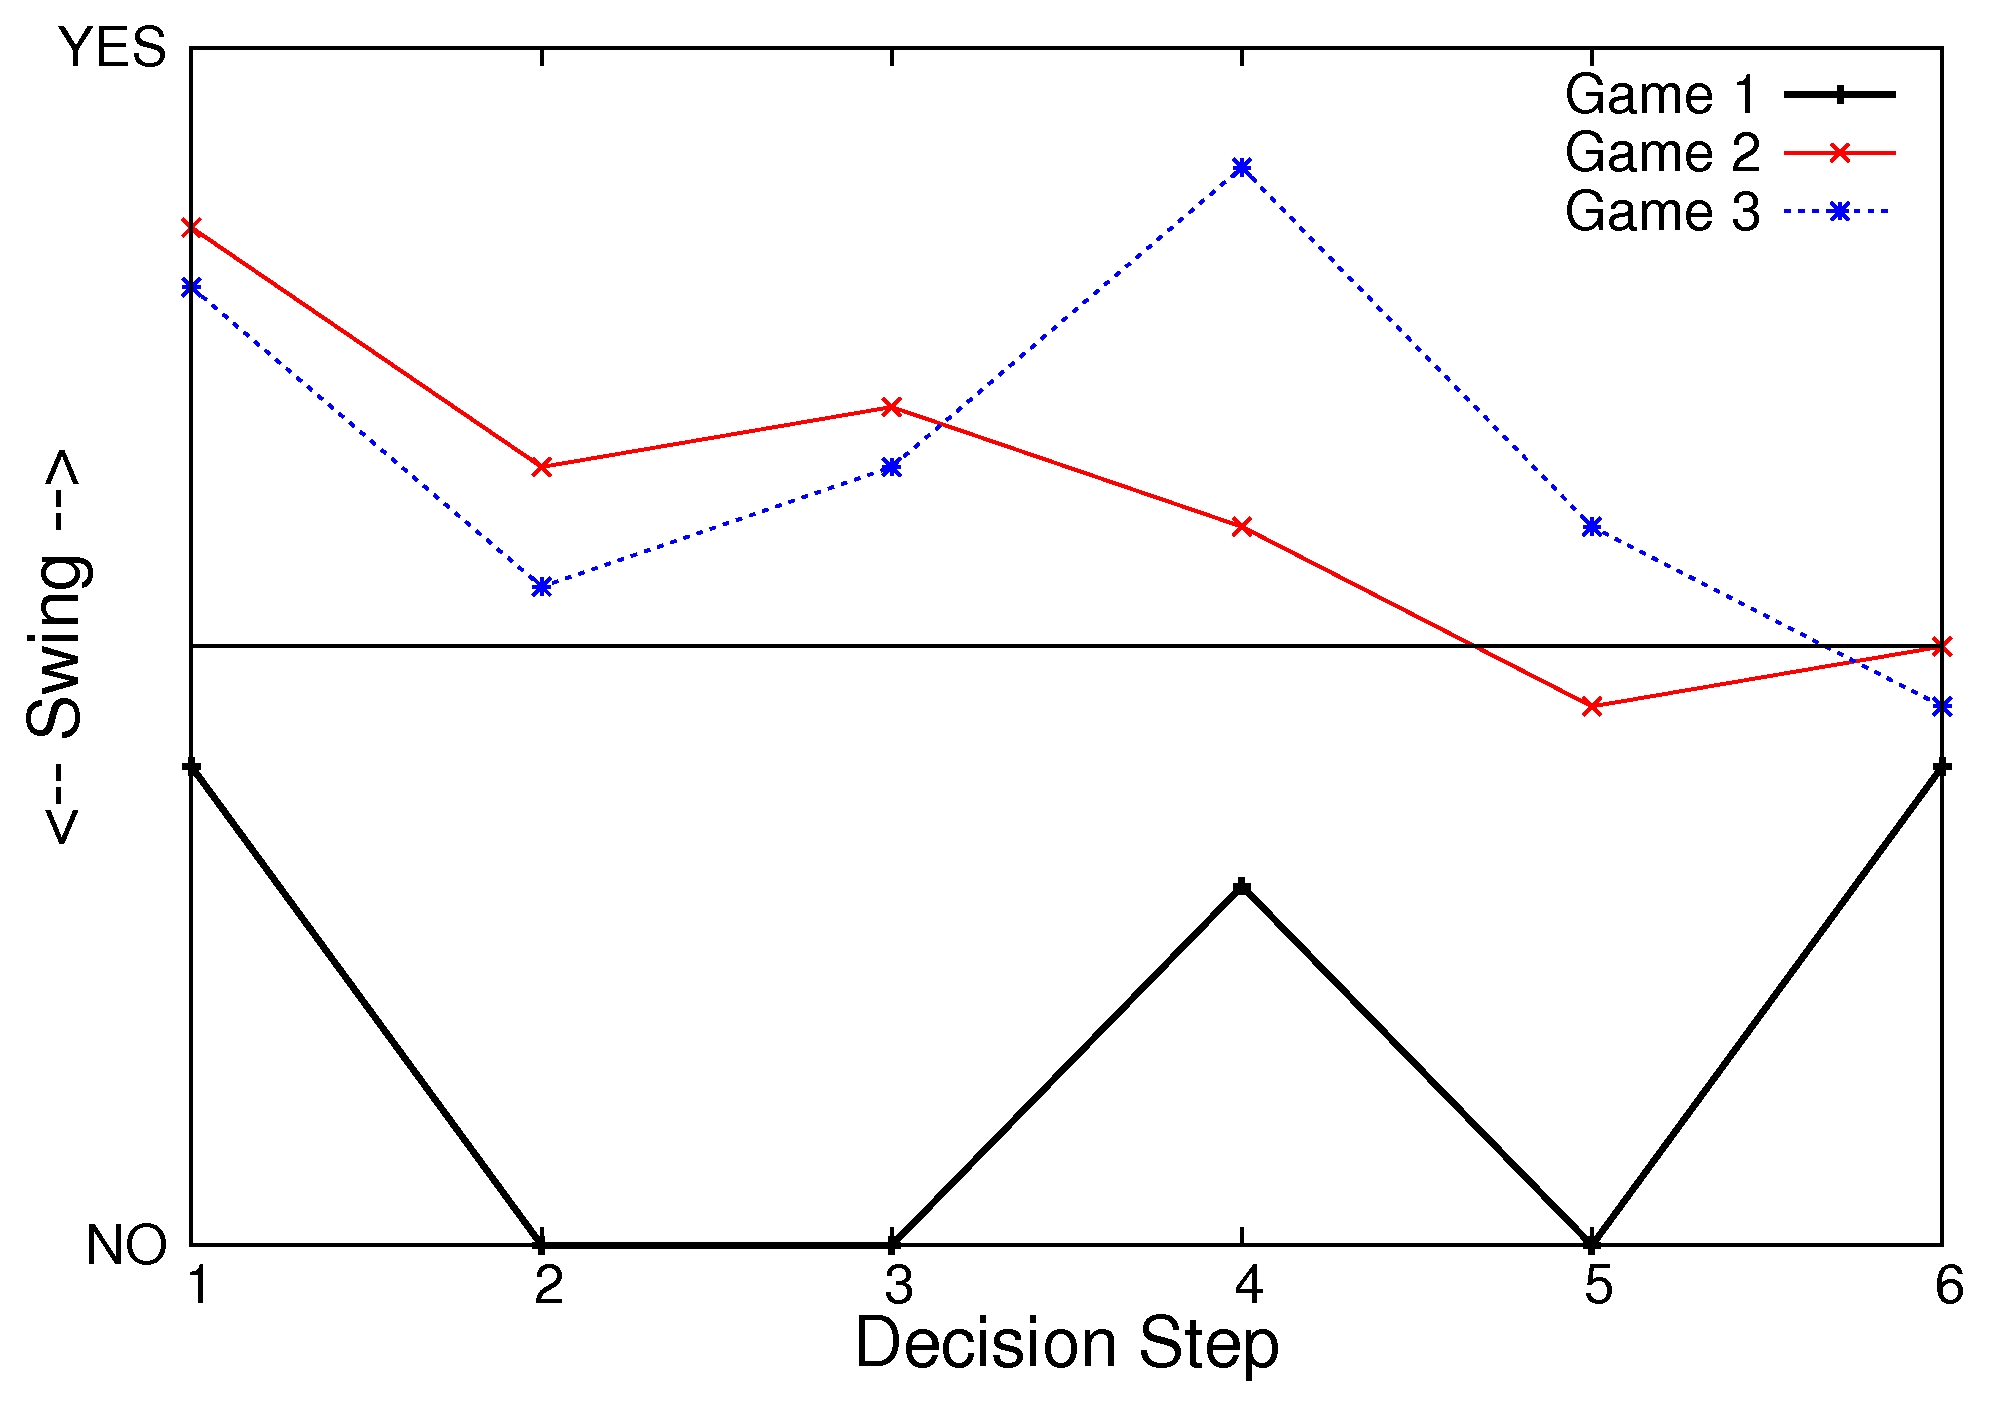
So what do the results reveal? The audience members in game 1 voted consistently to oppose the adaptation scheme. In games 2 and 3 initial support for the scheme, based on limited information, waned over the duration of the game. Interestingly, despite large variability between the results from the three games in the early decision stages, the final decisions were very close; the audience in games 1 and 3 voted marginally to oppose the scheme whilst the audience in game 2 was split 50/50. Presumably this was partly the inevitable result of choosing a decision problem where the information was fractured and uncertain; yet I struggle to think of any climate change adaptation decisions where this is not the case.
One might have assumed that the percentage of people making a decision should have increased over the duration of the games. Broadly, this is what was observed. However in Game 1, after the third decision step the percentage of people who made a decision (YES/NO) decreased dramatically (shown by the black line in the right graph). Maybe people were confused by the concept of the game but on the other hand maybe the result reflects the fact that sometimes more information can lead to more confusion about the right course of action to take; the phrase “ignorance is bliss” comes to mind. Curiously the people who did vote after stage 3, continued to vote unanimously NO.
As I observed the voting patterns of individuals, I noticed that some audience members had made up their mind after just one piece of information. Either due to preconceptions about the proposed adaptation scheme, a genuine belief that the information continued to support their position, or plain stubbornness, these individuals ardently continued to vote the same way throughout the six decision stages. Other individuals appeared to be more fickle and their votes seemed to change according to the latest piece of information. One of the aspects I found particularly interesting was how people voted after a particularly key (at lest in my view) piece of information. Observed rainfall for the region over a period of thirty years revealed a slowly decreasing linear trend but was masked by large inter-annual and apparent decadal variability. I had envisaged that the high level of observed variability would lead most to abandon the need for a climate change adaptation measure specifically recommended to reduce the risk of droughts. However this piece of information seemed to polarise the audiences. I can only speculate that people with different areas of expertise interpreted this piece of evidence differently. Of course throughout the game people may well have been confused about exactly what was going on so there is undoubtedly some noise in the results. Nevertheless I imagine that this feature is common to any decision making activity involving a group of people with different areas of expertise.
I certainly felt that running the game with delegates at COP 17 was a useful exercise to demonstrate the nuanced nature of decision making under uncertainty. Furthermore it illustrates the challenges in communicating climate information to people with different levels of scientific understanding and interest. In writing this blog I realise that there is much more I can say regarding the analysis but at the risk of boring the reader I omit some of my interpretation. Nonetheless this shows how much insight one can gain from a seemingly simple “game”. I do hope those who played the game enjoyed it!